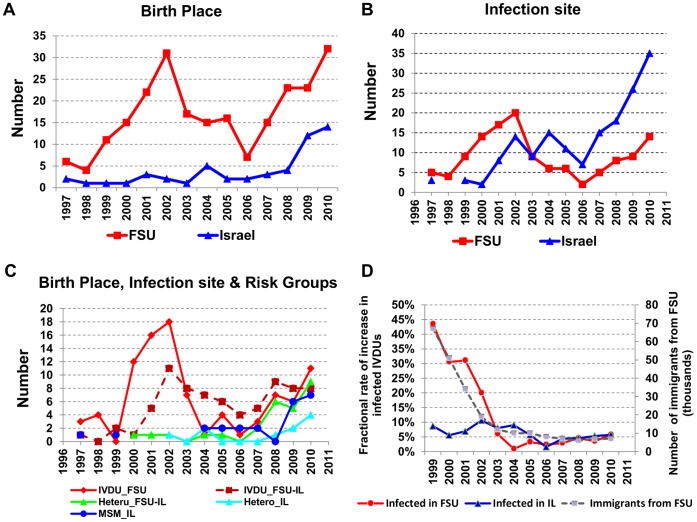
Figure 1. Propagation and incidence rates of A/AE-HIV in Israel.
A. Birth sites of individuals diagnosed with A/AE by year of diagnosis. (FSU – red squares; Israel – blue triangles). B. Infection site of individuals diagnosed with A/AE by year of diagnosis. (FSU – red squares; Israel – blue triangles). C. Birth site and infection place of A/AE-patients of specified transmission groups, by year of diagnosis. Red solid line – IVDU born and infected in FSU; dashed brown line – IVDU born in FSU and infected in Israel; green solid line – heterosexuals (mostly females) born in FSU and infected in Israel; light blue solid line – heterosexsuals born and infected in Israel; blue solid line – MSM born and infected in Israel. D. Newly-diagnosed IVDU infected in Israel (blue triangles) or in FSU (red circles) per-year as a fraction of the total number of A/AE-infected IVDU in the same year. Also shown are the total numbers of immigrants from FSU to Israel per-year (dashed line). FSU – Former Soviet Union; IVDU – Intravenous drug users; Is – Israel; MSM – Men who have sex with men.

