Fig. 1.

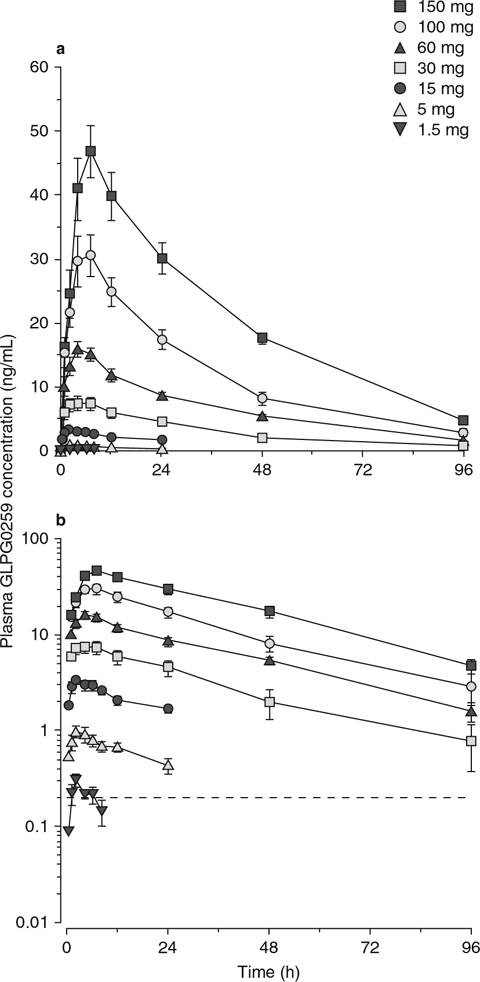
Mean (± standard error of the mean) plasma GLPG0259 concentrations after single oral doses in fed healthy subjects (n = 6 per dose group): (a) linear and (b) semi-logarithmic plots.

Mean (± standard error of the mean) plasma GLPG0259 concentrations after single oral doses in fed healthy subjects (n = 6 per dose group): (a) linear and (b) semi-logarithmic plots.