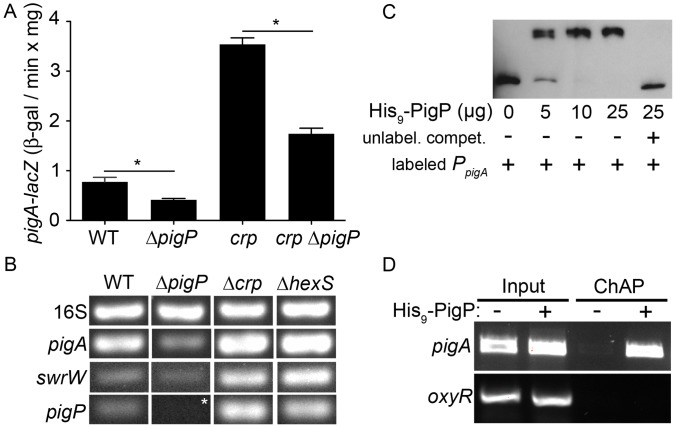
Figure 2. PigP transcriptional regulation of the pigment biosynthetic operon.
A. Expression of the pigA promoter measured using a chromosomal lacZ transcriptional fusion at early stationary phase. The average of 4 biological replicates is shown. Error bars indicate one standard deviation. One asterisk indicates a significant difference from (p<0.05, ANOVA Tukey’s post-test). B. RT-PCR of cDNA from stationary phase cells (OD600 = 3.5) with the 16S target as a control to show equal input cDNA. Genotypes are listed from left to right, and target cDNAs are listed from top to bottom, with 16S rDNA serving as an internal loading control. Representative images are shown. Asterisk indicates that there is no signal here because the pigP gene is deleted in this strain; this experiment serves as a negative control. C. EMSA assay with biotinylated pigA promoter DNA (4 ng) with or without recombinant PigP protein (His9-PigP) and with (+) or without (−) unlabeled competitor pigA promoter DNA (500 ng). D. Chromatin affinity purification (ChAP) enrichment of pigA promoter DNA, but not oxyR promoter DNA in cells expressing a functional His9-PigP (+), but not the vector alone negative control (−). “Input” indicates sheared DNA before affinity purification and shows similar levels of starting DNA.

