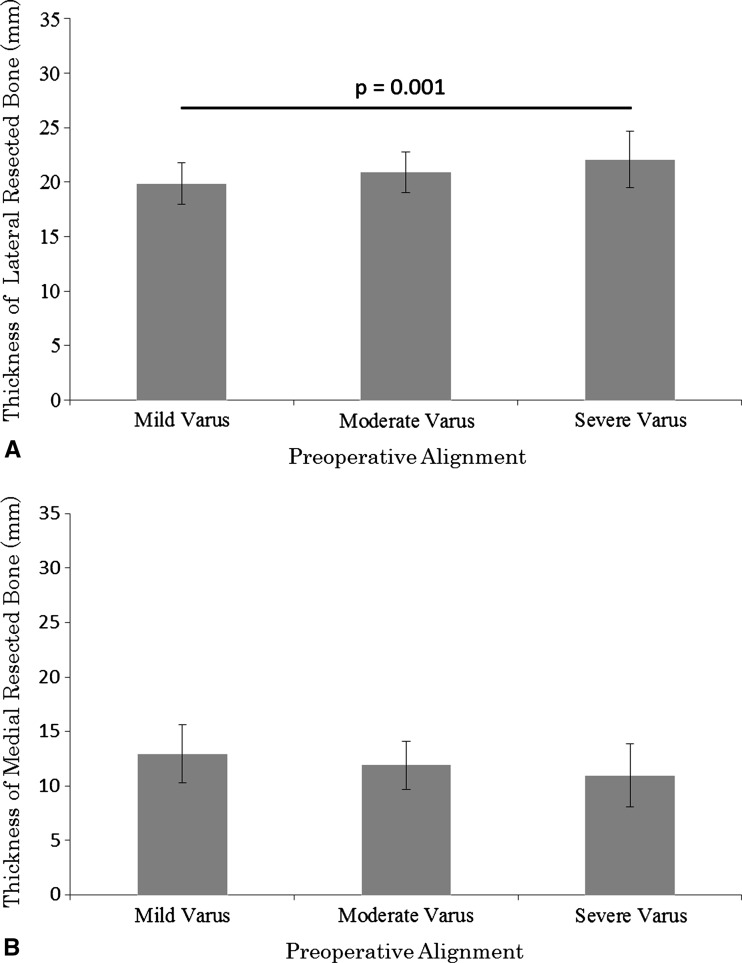
Fig. 5A–B.
The graphs compare the thicknesses of the resected bone with preoperative alignments. The data are shown as mean ± SD. (A) The thickness of the lateral resected bone was larger in the severe varus group than in the mild varus group. (B) There were no differences in the thickness of the medial resected bone among groups.

