
Fig. 5.
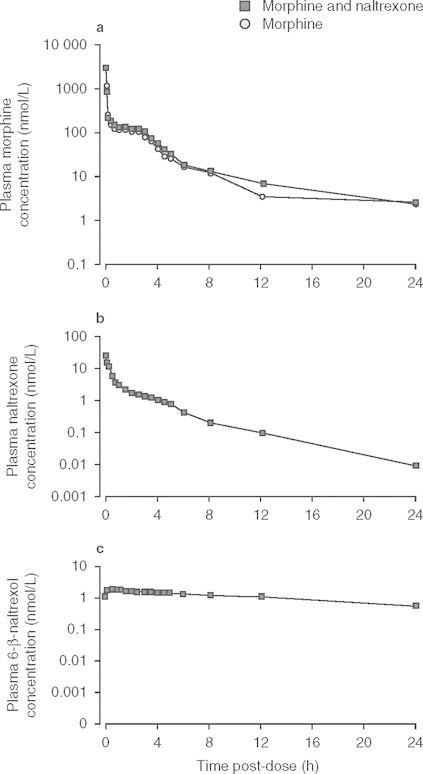
Mean (mean ± standard error of the mean) plasma concentration-time plots for plasma (a) morphine, (b) naltrexone, and (c) 6-ß-naltrexol after intravenous administration of morphine (n = 28) or morphine plus naltrexone (n = 26) as a function of time (ordinate) since drug administration in the evaluable pharmacodynamic population.