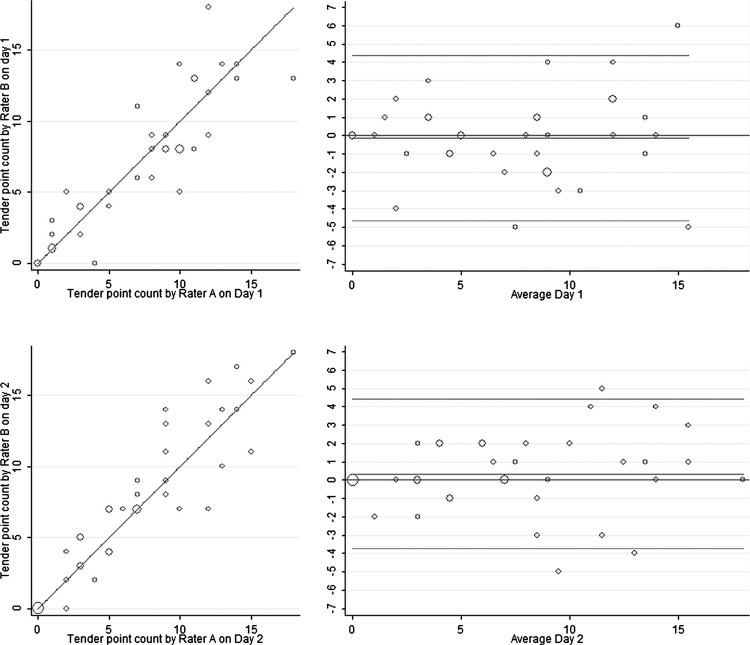
Figure 4.
Inter-rater reliability and agreement. Reliability with lines of equality shown in the left panel. Agreement shown by Bland-Altman plots in the right panel displaying differences of tender point (TP) counts on the y-axis and the average of TP counts on the x-axis. The upper and the lower horizontal lines represent 95% limits of agreement. Areas of the circles are proportional to the number of observations.

