Figure 4.

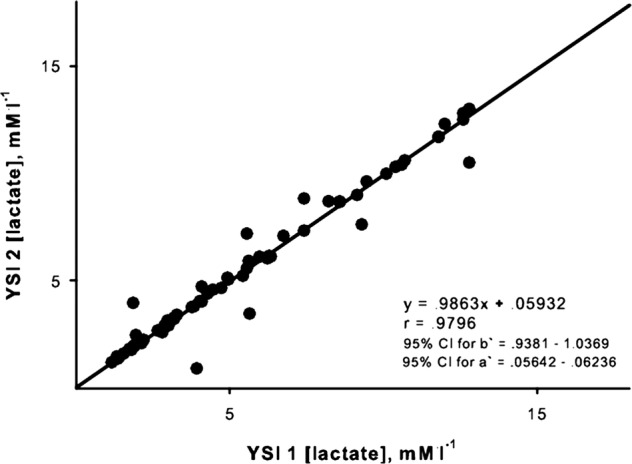
Ordinary least products regression analysis of the relation between sequential estimates of blood lactate concentration by the YSI bench top analyzer. Regression equation and CIs for slope (B) and y-intercept (A) are presented.

Ordinary least products regression analysis of the relation between sequential estimates of blood lactate concentration by the YSI bench top analyzer. Regression equation and CIs for slope (B) and y-intercept (A) are presented.