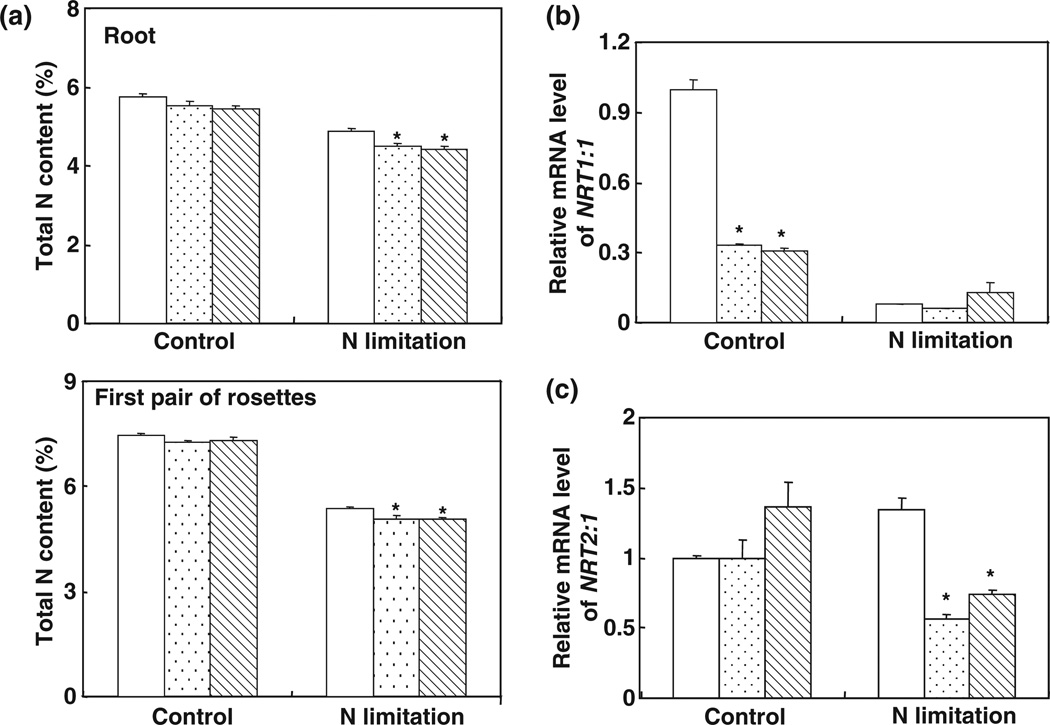
Fig. 6.
Decreased nitrogen (N) content in 35S::MIR169a plants. (a) N concentration in the roots and the first pair of rosettes of wild-type (WT) or 35S::MIR169a transgenic plants (WT, open bars; #10, stippled bars; #11, hatched bars) grown hydroponically with full nutrients for 5 wk and then N-starved for 3 d. Error bars indicate SD (n = 4). *, P < 0.05 (t-test); significant difference from the WT. (b) NRT1.1 (nitrate transporter 1.1) mRNA levels in 35S::MIR169a transgenic plants. Total RNA from roots described in (a) was used for reverse transcription followed by quantitative PCR. The expression levels were normalized to that of Tub4 (Tubulin Beta Chain 4). (Col, open bars; #10, stippled bars; #11, hatched bars.) Results are the mean ± SE for three biological replicates. *, P < 0.05 (t-test); significant difference from the WT. (c) NRT2.1 mRNA levels in 35S::MIR169a transgenic plants (Col, open bars; #10, stippled bars; #11, hatched bars). Total RNA from roots described in (a) was used for reverse transcription followed by quantitative PCR. The expression levels were normalized to that of Tub4. Error bars represent SEs (n = 3). Results are the mean ± SE for three biological replicates. *, P < 0.05 (t-test); significant difference from the WT.

