
Fig. 2.
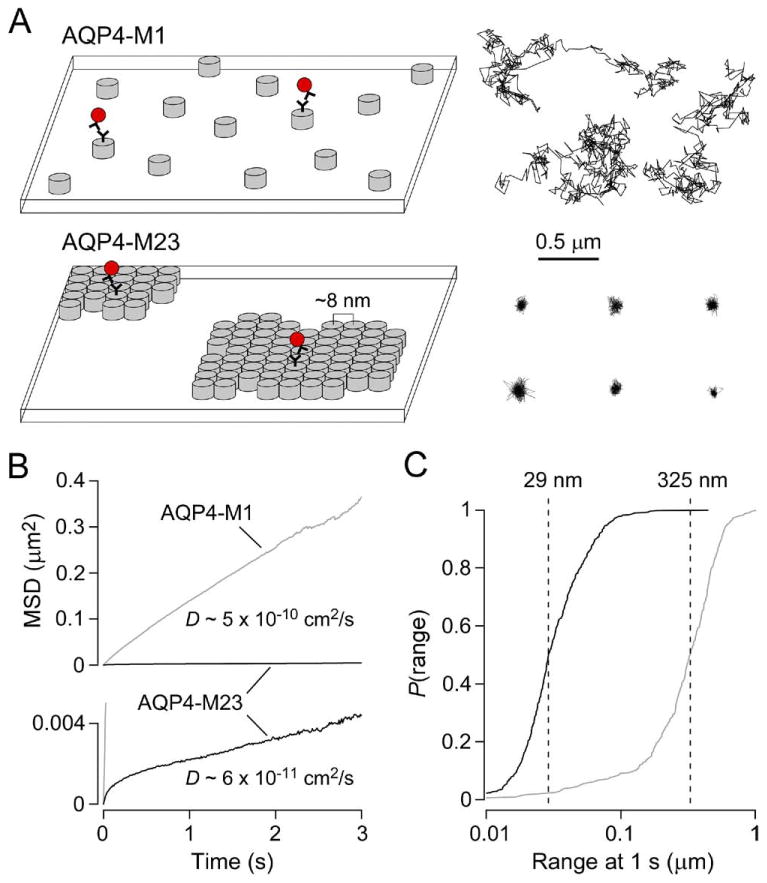
Membrane assembly and diffusional mobility of M1 and M23 isoforms of AQP4. (A) Schematic showing the organization of AQP4 tetramers (left) and representative single particle trajectories (right) of quantum dot-labeled AQP4 molecules in the plasma membrane of COS-7 cells expressing AQP4-M1 (top) or AQP4-M23 (bottom). Each grey cylinder represents one AQP4 tetramer. A subset of AQP4 molecules are labeled with quantum dots (red) for single particle tracking. (B) Combined MSD vs. time plots and averaged diffusion coefficients for AQP4-M1 (grey) and AQP4-M23 (black) in COS-7 cells. (C) Cumulative probability distribution of ranges at 1 s (P(range)) for AQP4-M1 (grey) and AQP4-M23 (black), with dashed lines indicating median range.