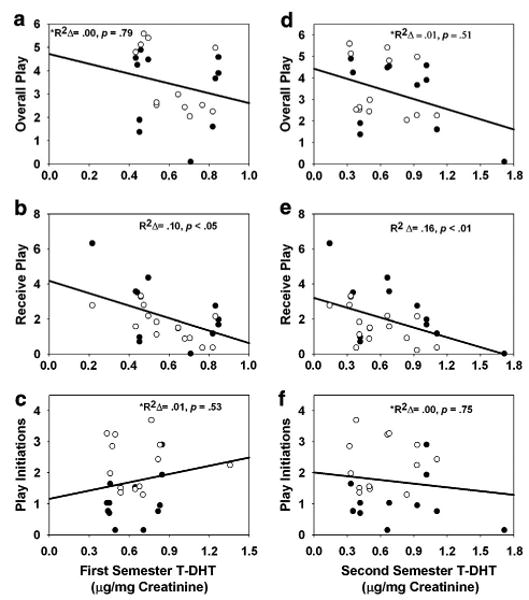
Fig. 2.

Rates of overall play, play receptions, and play initiations with all members of the family group as a function of first semester gestational T-DHT (a-c) and second semester T-DHT (d-f). Play behaviors (on vertical axes) are average frequencies per 20-min focal observation period. Open circles represent males; closed circles represent females. *Indicates instance in which an outlier was removed.
