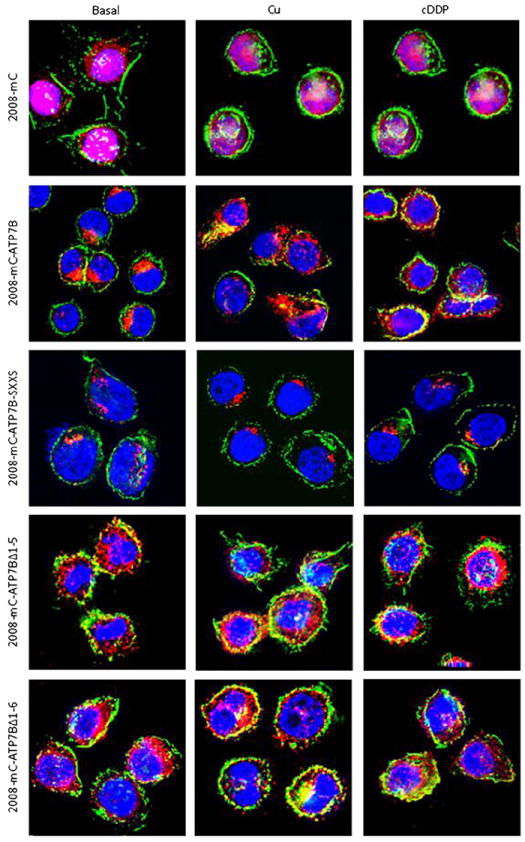
Fig. 6.

Deconvoluting fluorescence microscopic analysis of the subcellular distribution in 2008 cells of mCherry (mC) and mCherry tagged ATP7B and variants mC-ATP7B SXXS, mC-ATP7B Δ1–5 and mC-ATP7B Δ1–6, in basal medium and following exposure for 15 min to 100 μM CuCl2 or 30 μM cDDP. Green is FITC-phalloidin; nuclei are stained blue with Hoechst 33342; mCherry protein is red.
