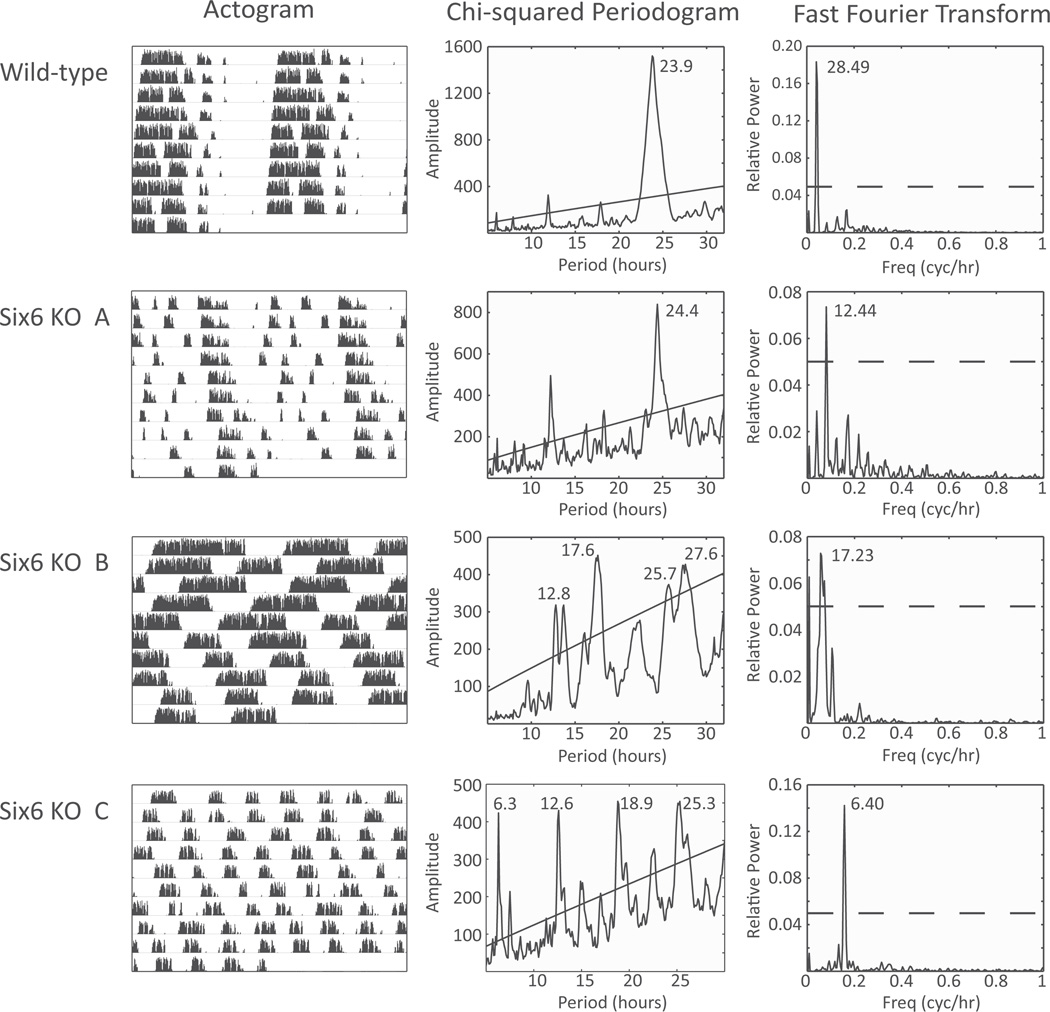
Figure 3.
Wheel-running activity during constant darkness. (Left) Wild-type and Six6-null mouse wheel-running actograms are shown for 10 days of activity in constant darkness. (Middle) χ2 periodogram analysis of the actogram data. Diagonal line represents p = 0.05 significance threshold. (Right) Fast Fourier transform of the actogram data. Peak period listed; dotted line represents 0.05 relative power. Knockout mice A, B, and C are the same individual animals as in Figure 2.

