Figure 1.
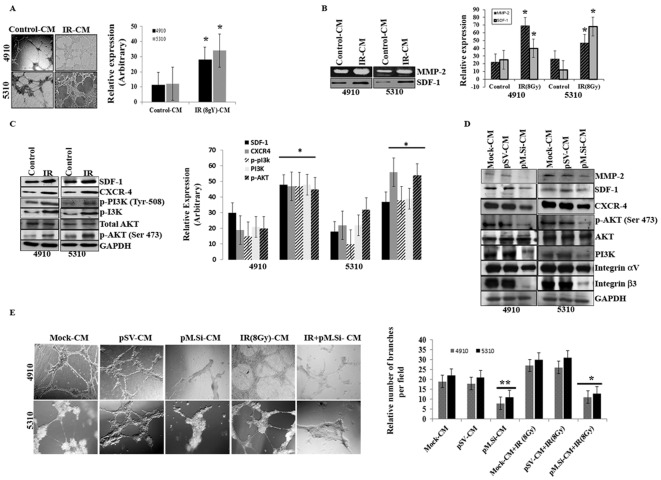
pM.Si-CM downregulates IR-induced angiogenesis in human xenograft cell lines 4910 and 5310. Cells (4910 and 5310) were treated with mock, pSV or pM.Si alone or in combination with IR (8 Gy) as described in Materials and methods. (A) In vitro angiogenesis. The conditioned media was added to 96-well plates that were coated with Matrigel and pre-seeded with human dermal microvascular endothelial cells (ECs) (2×10⁴ cells/well). After overnight incubation at 37°C, cells were observed under the bright field microscope for the formation of capillary-like structures. The degree of angiogenic induction by mock- and IR-CM were quantified for the numerical value of the product of the relative capillary length and number of branch points per field and indicated in a bar diagram. The data are presented as the mean ± SE of three independent replicates with significance denoted by *p<0.01. (B) Gelatin zymography (MMP-2) and western blot analysis (SDF-1) were performed. The experiments were carried out thrice and the data are presented as the mean ± SE of three independent replicates with significance denoted by *p<0.01. (C) Seventy-two hours post-transfection, xenograft cells were harvested and whole cell lysates were prepared using RIPA buffer. Whole cell lysates were subjected to western blotting for SDF-1, CXCR4, p-PI3K (Tyr 508), PI3K, AKT and p-AKT (Ser 473). GAPDH was used to confirm equal loading. The data are presented as the mean ± SE of three independent replicates with significance denoted by *p<0.01. (D) ECs were grown on the mock-, pSV- and pM.Si-CM for 16 h. Cells were then collected and whole cell lysates were subjected to western blotting for MMP-2, SDF-1, CXCR4, p-AKT (Ser 473), AKT, PI3K and integrin αvβ3. The blots were stripped and re-probed with GAPDH antibody as an internal control for the respective proteins. (E) In vitro angiogenesis was performed under similar conditions as described for (A). The degree of angiogenic induction was quantified for the numerical value of the product of the relative capillary length and number of branch points per field. The data are presented as the mean ± SE of three independent replicates with significance denoted by *p<0.05 and **p<0.01.

