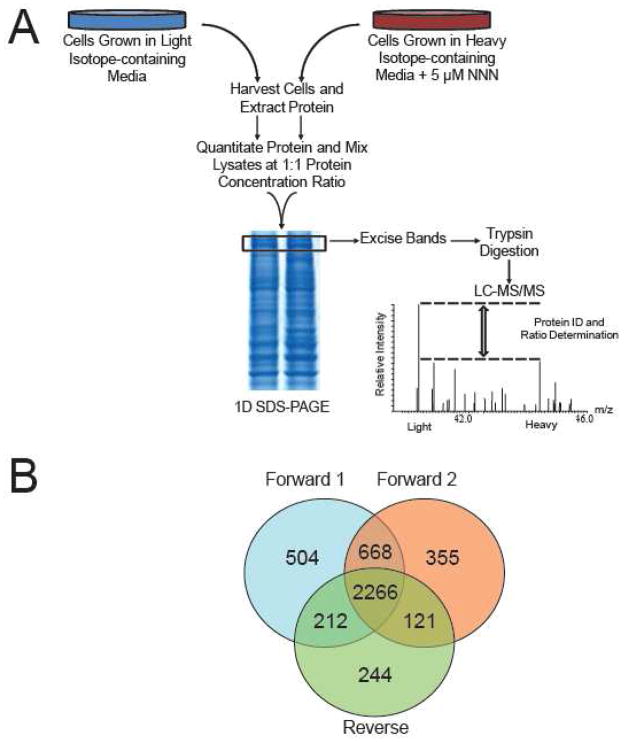
Figure 1.
SILAC-based quantitative proteomics. (A) Flowchart of reverse SILAC coupled with LC-MS/MS for the comparative analysis of protein expression in GM00637 cells following NNN treatment. In forward SILAC experiments, light Lys- and Arg-labeled cells were treated with 5 μM NNN, whereas the heavy Lys- and Arg-labeled cells were used as vehicle control. (B) A Venn diagram summarizing the number of proteins quantified from three independent SILAC (two forward and one reverse) experiments.

