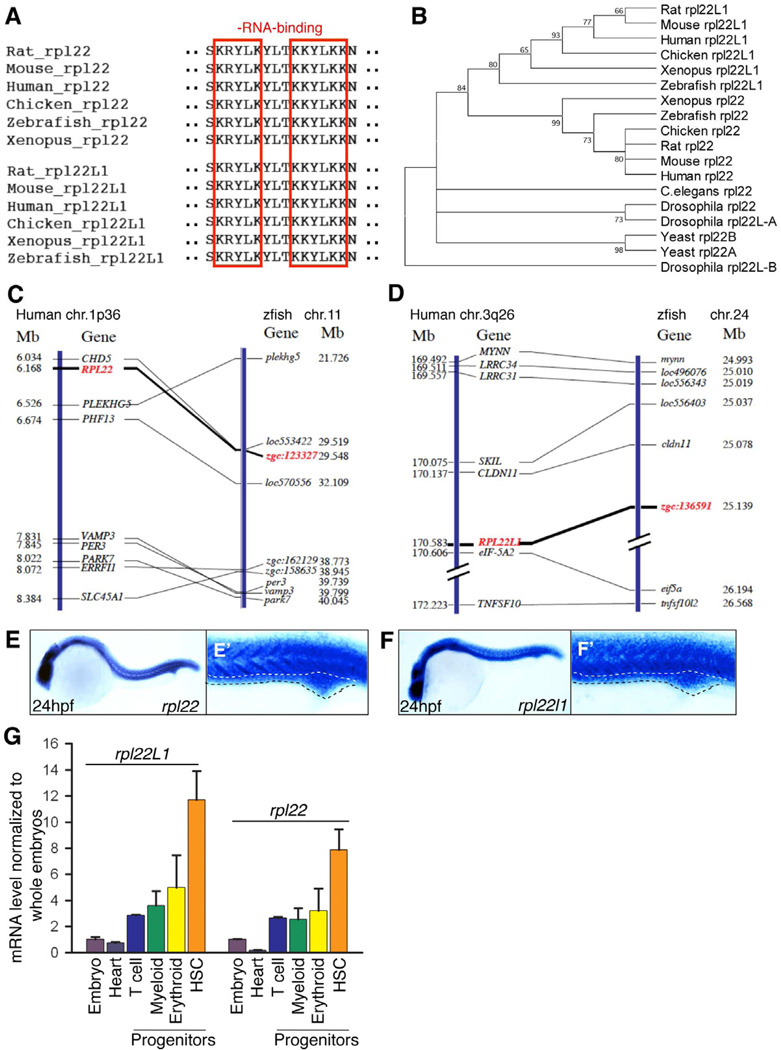
Figure 1. Bioinformatic and expression analysis of zebrafish rpl22 and rpl22l1.
(A–D) Sequence alignment of RNA-binding domains, phylogenetic analysis, and synteny analysis. (A) Red-boxed area denotes RNA-binding motif. (B) Numbers on the branches of the phylogenetic tree are bootstrap values. (C) The human the human (1p36) and zebrafish rpl22 loci (LG11) are flanked by a common set of genes (CHD5, PLEKGH5, PHF13, VAMP3, PER3, PARK7, ERRF11, and SLC45A1). (D) Human RPL22L1 (3q26) and zebrafish loci (lg24) are flanked by a common set of genes (MYNN, LRRC34, LRRC31, SKIL, CLDN11, EIF-5A2, and TNFSF10). Orthologous RPL22 and RPL22L1 gene symbols are in red and bold.
(E–F’) Zebrafish rpl22 and rpl22l1 WISH analysis on 24 hpf embryos. (E,F) Lateral views with head to the left. (E’, F’) Insets depict the ICM region delimited by dashed lines.
(G) Real time PCR quantification of rpl22 and rpl22l1 mRNA levels in hematopoietic progenitor populations. Tg fish lines were employed to identify the following progenitors: 1) Heart, cmcl2:EGFP at 2dpf; 2) T cell, lck:EGFP at 5dpf; 3) Myeloid, mpo:EGFP at 5dpf; 4) Erythroid, gata1:dsRED2 at 5dpf; and 5) HSC, cd41:EFGP at 3.5dpf. GFP+ cells were isolated by flow cytometry, following which rpl22 and rpl22l1 expression was measured by real time PCR. Results of triplicate measurements were normalized to b-actin and whole embryo homogenates and represented graphically as the mean ±S.D.
The results were combined from at least 3 separate experiments with representative photographs depicting the observed phenotypes. Unless otherwise specified, all images represent lateral views with the head to the left. See also Figure S1.

