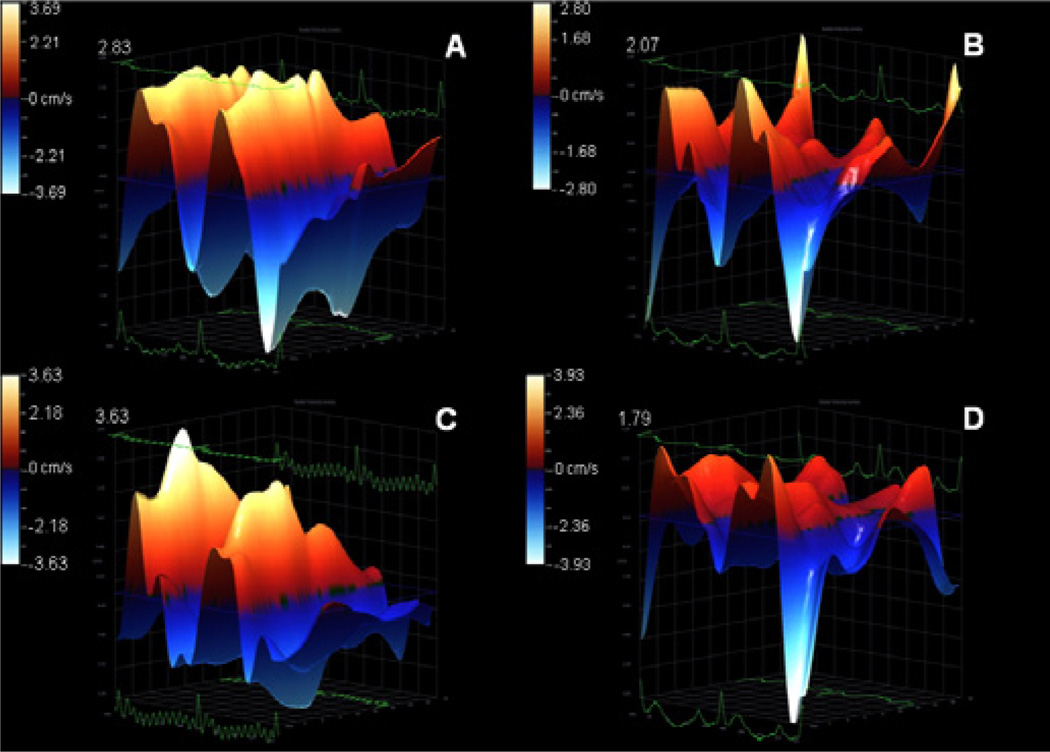
Figure 2.
Illustrative 3D parametric displays of global left ventricle radial velocity with the Vevo strain software in one Wistar rat of each experimental group: control (A), doxorubicin (B), doxorubicin + stem cell (C), doxorubicin + Camellia sinensis (D). The upper value of each graph was highlighted to better visualization.

