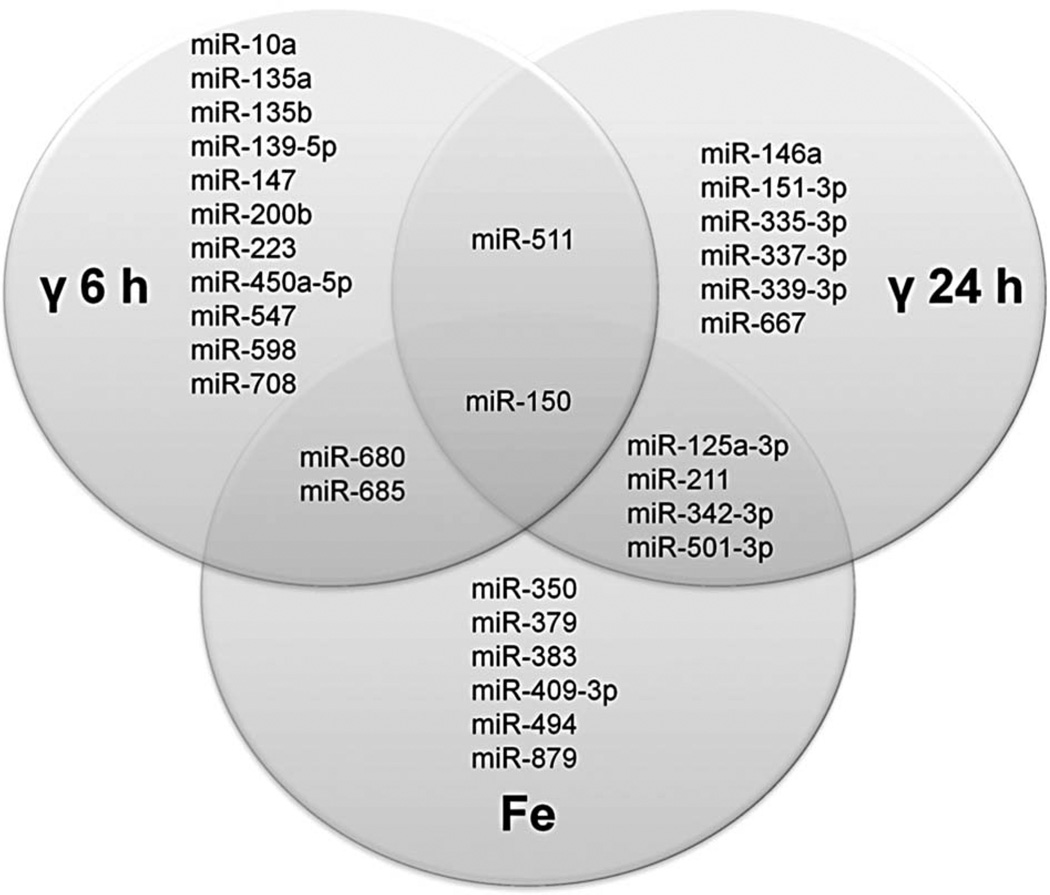
Figure 1.
Venn diagram showing miRNA differentially expressed in the indicated irradiation conditions. Areas of overlap among different circles depict miRNA differentially expressed in multiple conditions. For simplicity, miRNA expression at different doses of irradiation is not distinguished in the diagram, and miRNA that are differentially expressed at any dose corresponding to the respective radiation type and time point are shown. Both time points are combined for miRNA differentially expressed upon 56Fe irradiation.

