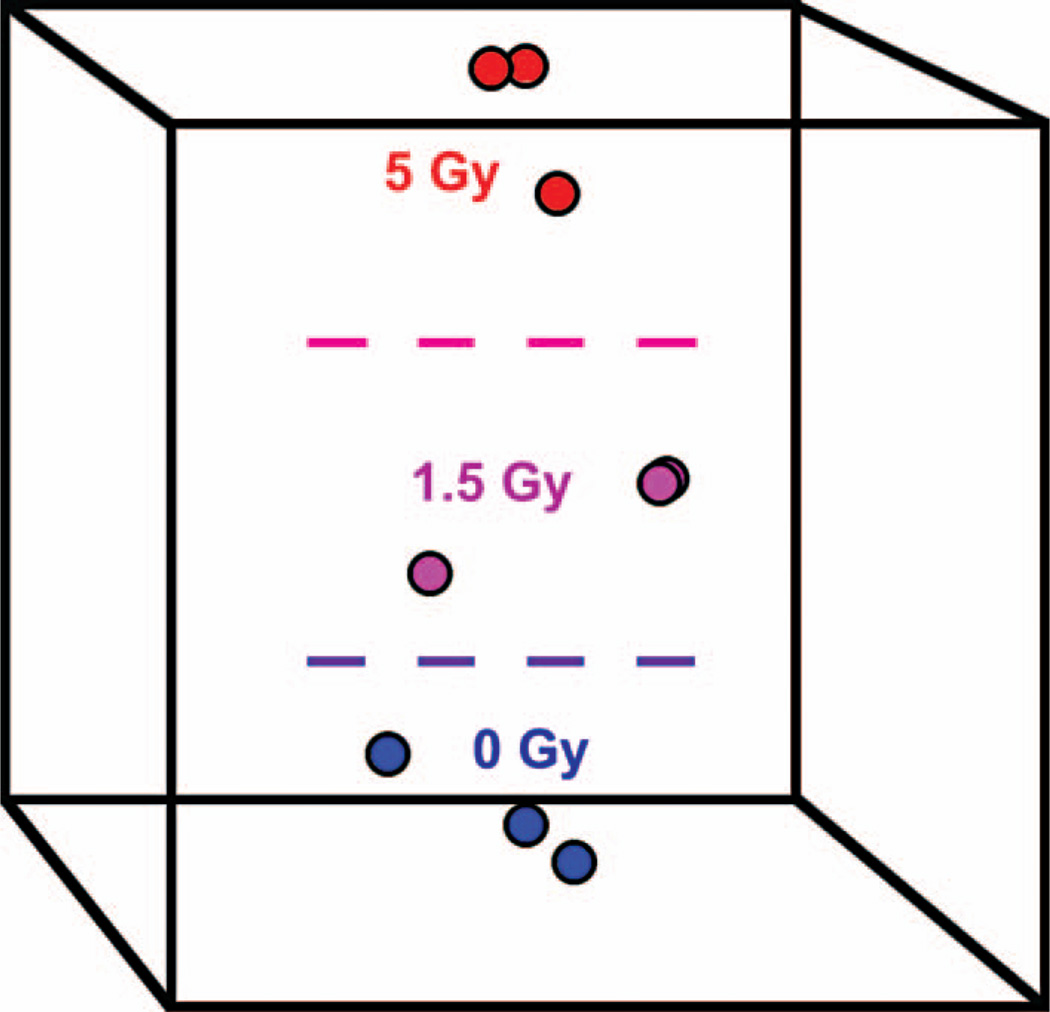
Figure 2.
Clustering of samples by means of multidimensional scaling (MDS). The nine γ ray-treated samples collected at 24 h after irradiation were projected onto a space spanned by three orthogonal axes (represented by the box) that optimally preserves the information about the differences in miRNA expression levels among the three irradiation conditions. A Euclidian distance metric was used to construct the MDS axes. The distance between any two points (samples) reflects their overall similarity with respect to the expression levels of the miRNA included in the classifier. As can be seen from the plot, MDS is able to separate the samples according to radiation dose.

