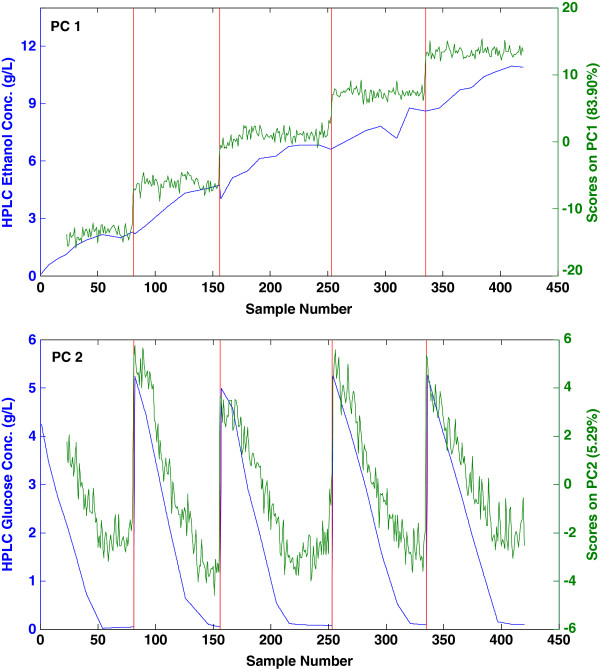
Figure 2.
There is a strong correlation of the scores data to the reference ethanol and glucose concentrations from HPLC. The blue lines show the concentration of the analytes by HPLC while the green shows the principal component score of the Raman data. Ethanol correlates to PC1 (top) while glucose can be seen on PC2 (bottom). The red lines indicate added aliquots of glucose.

