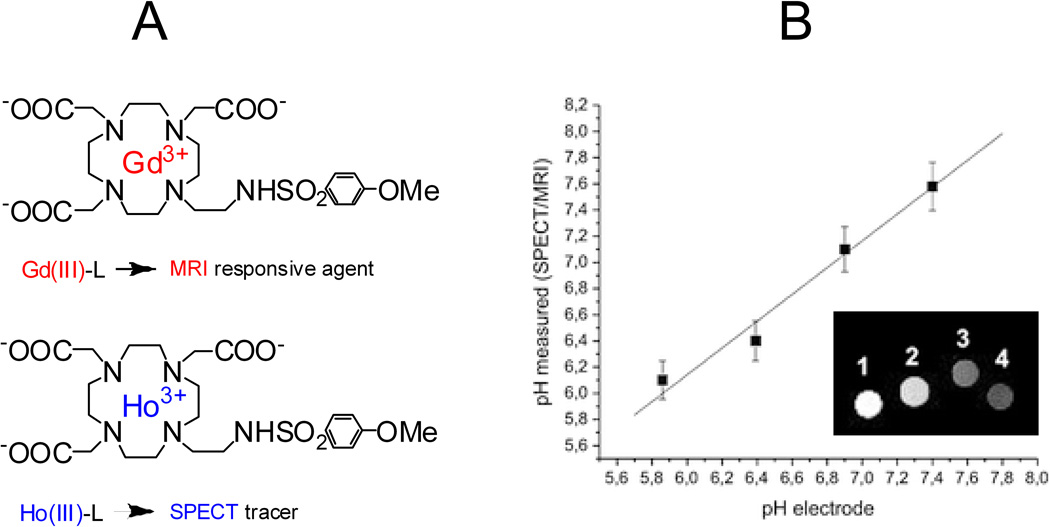
Figure 5.
A: The dual MRI/SPECT system that contains two lanthanide(III) ion chelates. B. Relationship between the pH values measured through pH–electrode and through SPECT/MRI analysis. Inset: MRI images of the phantom containing the four samples at (1) pH 5.9; (2) pH 6.4; (3) pH 6.9; (4) pH 7.4 after normalization with respect to the Gd(III) concentration of the four samples determined via SPECT measurements. Images from Ref (22).

