
Figure 2.
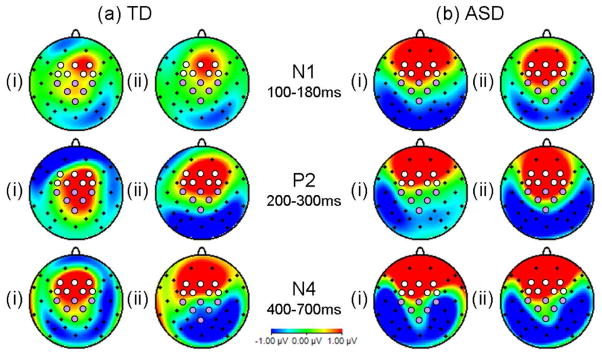
Maps indicating topography of AV effects, i.e. difference waves for (i) AVF-VF minus A and (ii) AVS-VS minus A in N1 (100–180ms), P2 (200–300ms), and N4 (400–700ms) time windows. Electrodes selected for ERP data analysis are indicated by white (fronto-central region) and mauve (centro-parietal) circles.