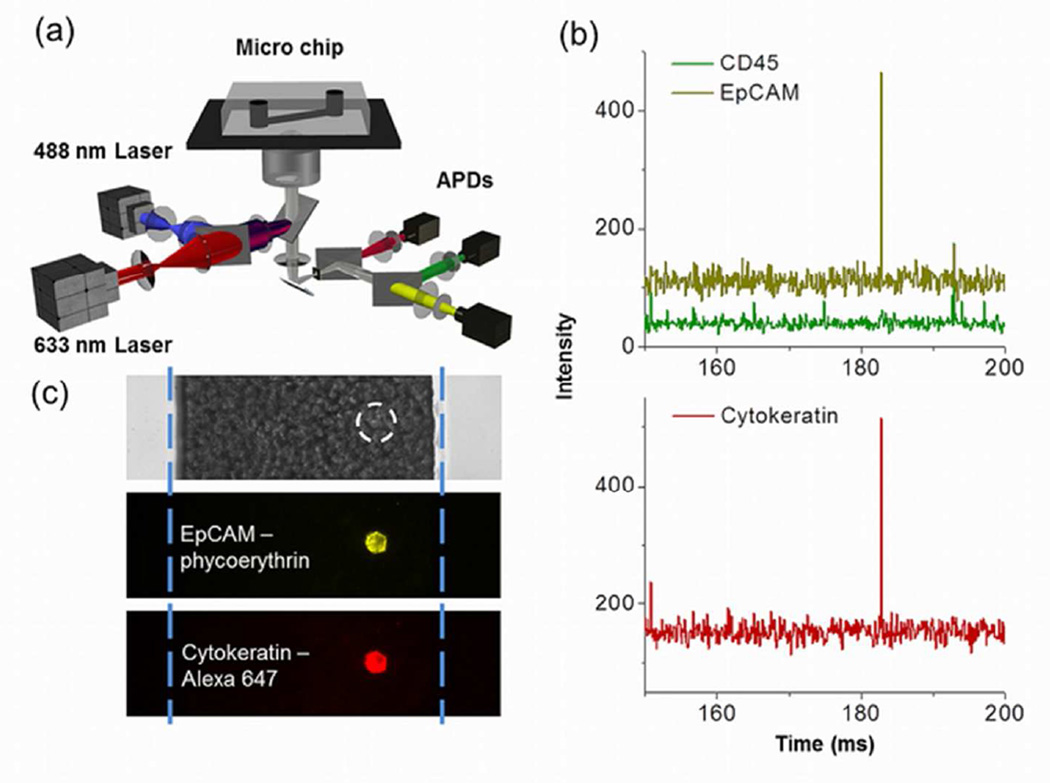
Figure 1.
Schematic and data illustrating the flow-detection platform. a) Depiction of the microfluidics and optics. b) CTC detection and identification scheme using APD signals. A typical CTC event at 183 ms is positive for EpCAM (Yellow signal) and cytokeratin (Red signal), but negative for CD45 (Green signal). c) A cultured MCF-7 cell imaged in the microfluidic channel filled with whole blood. The top panel shows a bright field image of the blood in the microchannel. The white dashed circle shows the location of the MCF-7 cell that is not visible beneath the many blood cells. The blue dashed lines show the location of the microchannel walls. Fluorescence images of the same location show the MCF-7 cell labeled with both anti-EpCAM and anti-Cytokeratin.

