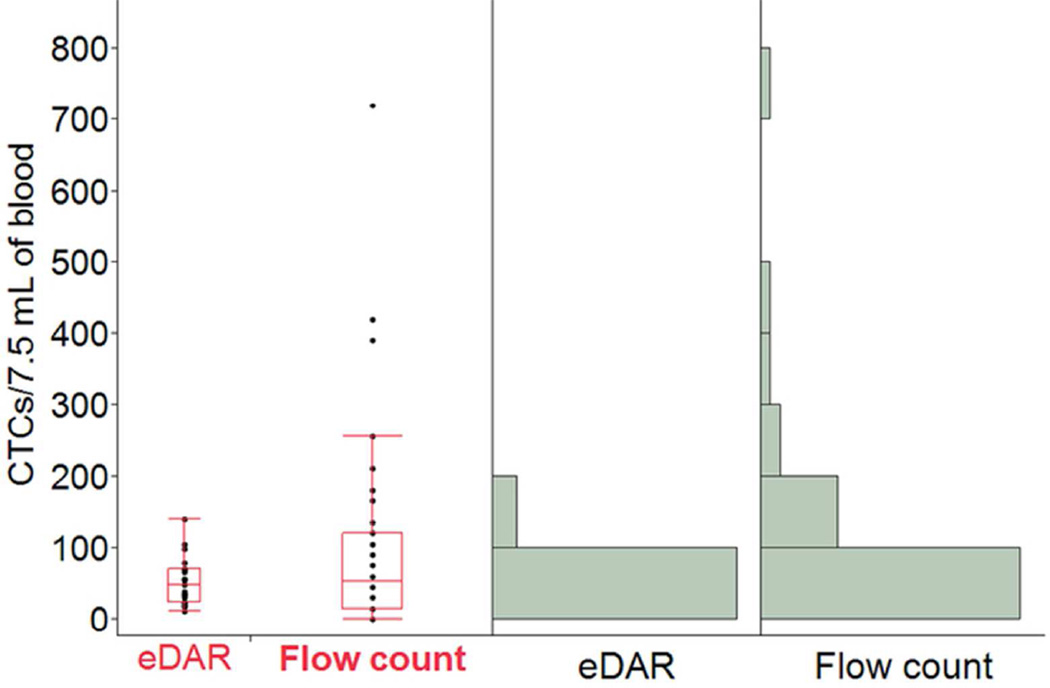
Figure 5.
Comparison of the CTC enumeration results from the same set of patients using eDAR and flow detection system. The left part is the box plots that show the smallest observation, lower quartile, median, upper quartile, and the largest observation of the two data sets (eDAR vs Flow count), respectively. The right part shows the histograms of the two data sets.

