
Figure 6.
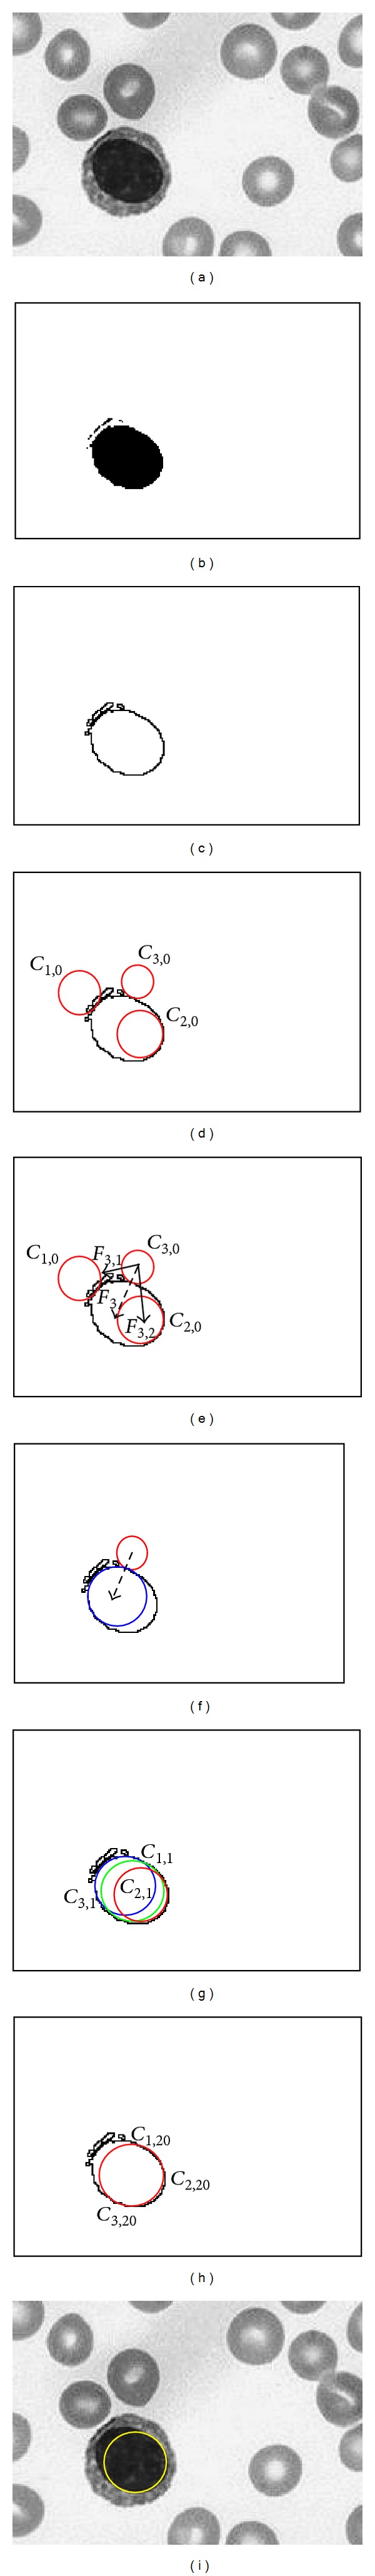
Detection numerical example: (a) The image used as example. (b) Segmented image. (c) Edge map. (d) Initial particles. (e) Forces exerted over C 3,0. (f) New position of C 3,0. (g) Positions of all particles after the first generation. (h) Final particle configuration after 20 generations. (i) Final result overlapped the original image.