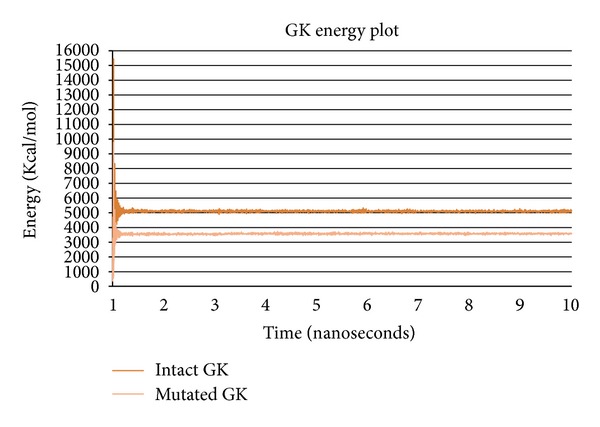
Figure 1.

GK energy plot showing the energy transitions of intact and mutated GK structures during molecular dynamics simulations for a period of 10 ns. Intact GK conformation is stabilized around the energy levels of 5000 Kcal/mol and mutated GK around 3500 Kcal/mol.
