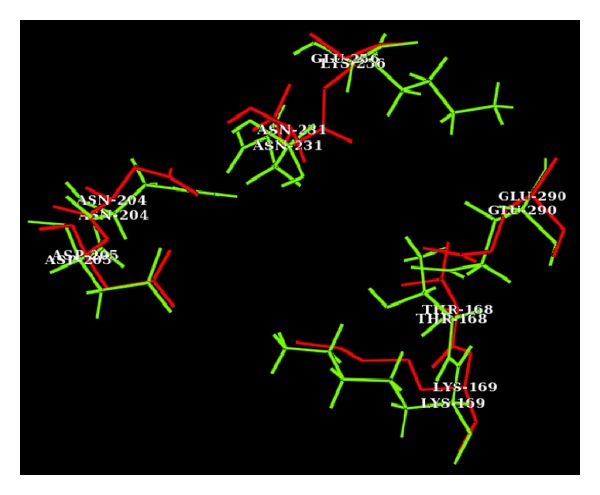
Figure 3.

Superimposition of substrate binding regions of intact (red) and 256 E-K mutated (green) GK structures. The distance between the superimposed residues explains the variation in volume and surface area of substrate binding region, which in turn influences the binding affinity with glucose.
