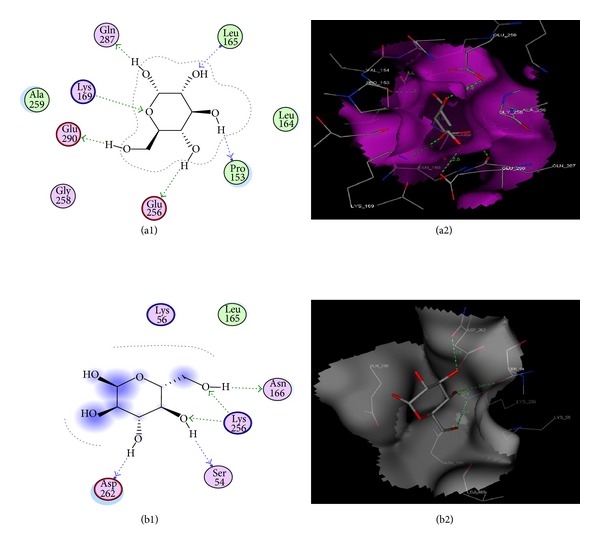
Figure 4.

Binding mode of glucose with intact and mutated GK active sites after molecular docking. (a1) Two-dimensional linear representation of the glucose interaction with intact GK active site residues showing 6 hydrogen bonds. (a2) Three-dimensional graphical representation of glucose interaction found to be sit in the active site cavity with hydrogen bond interactions. (b1) Two-dimensional linear representation of glucose interaction with mutated GK active site residues showing 5 hydrogen bonds. The blue-colored shade represents the solvent exposure area of glucose molecule. (b2) Three-dimensional graphical representation of glucose interaction found to be on the surface of active site cavity with limited hydrogen bond interactions.
