
Figure 6.
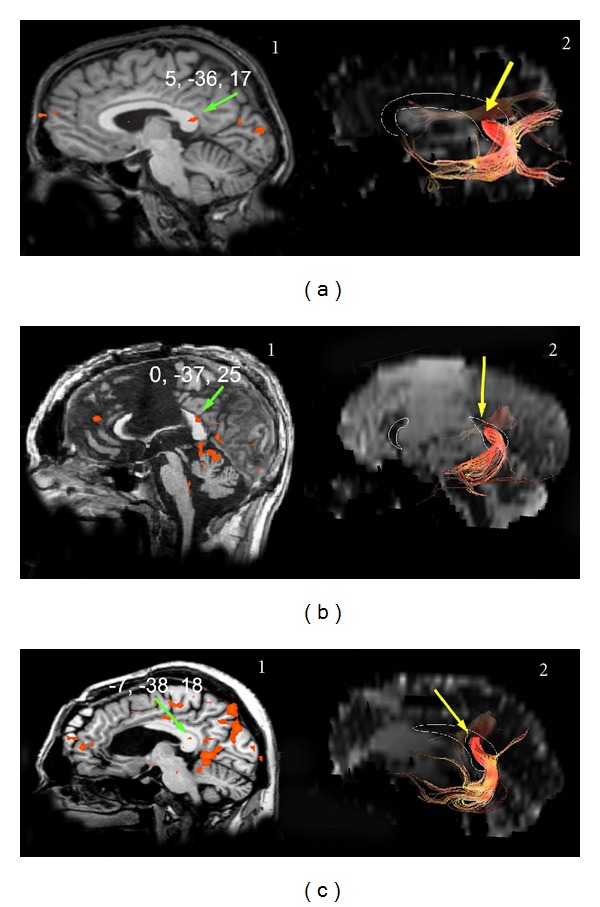
Activation evoked by auditory stimulation in control subject E.L. (a) and in patients P.F. (b) and O.T. (c). Callosal foci are visible in the control subject and in both patients ((a)1, (b)1, and (c)1, green arrows). Fibers arising from the activated cortex cross through the posterior CC, likely the isthmus ((a)2, (b)2, and (c)2, yellow arrows). On DTI images, a thin white line demarcates the CC. Numbers on each brain represent the Talairach coordinates (x, y, z) of each focus (green arrows).