
Figure 9.
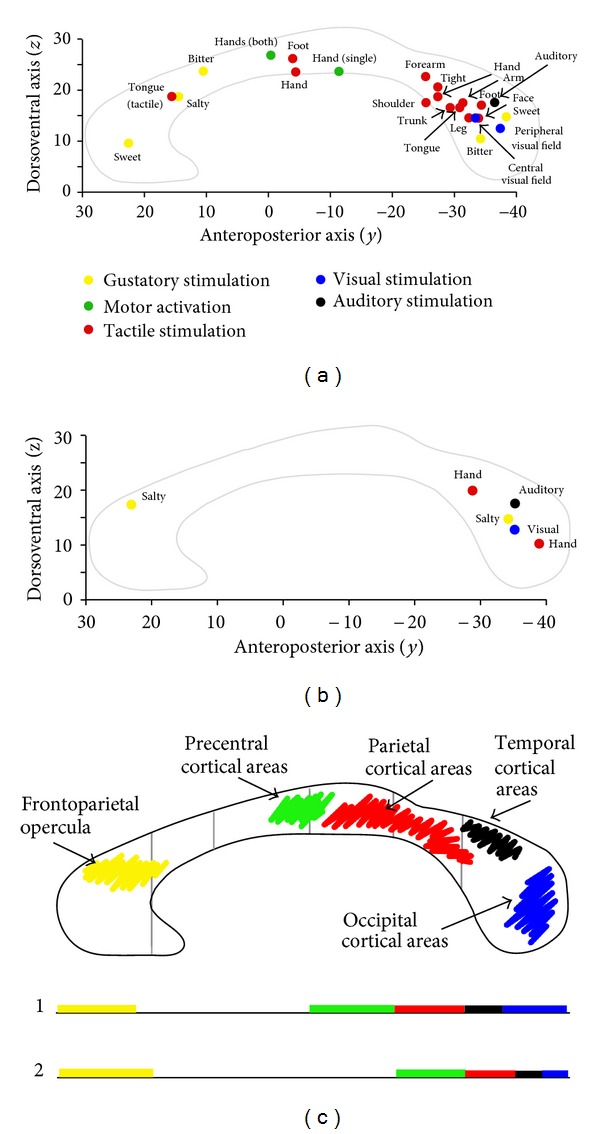
Summary schematic diagram showing the similar distribution of the callosal activation foci evoked by different stimulus types in controls (a) and patients (b). In (c) the distribution of callosal foci is compared to that of the crossing site of callosal fibers seen in our work and in the studies of Witelson [57] (gray lines), Hofer and Frahm (line 1, [58]), and Chao et al. (line 2, [59]). (a and b). Each dot represents the “mean” value of the y and z Talairach coordinates (reported on the respective Cartesian axes) of the foci evoked by different stimuli. Yellow: foci evoked by gustatory stimuli; green: foci evoked by hand motor tasks; red: foci evoked by tactile stimuli; black: foci evoked by auditory stimuli; blue: foci evoked by visual stimuli. See the text for a detailed description. (c) shows the crossing sites of interhemispheric fibers connecting the sensory and motor cortical areas activated by the relevant peripheral stimuli. Vertical gray lines mark the main CC subdivision according to Witelson [57]. Line 1 and line 2 on the bottom show the CC subdivision according to Hofer and Frahm (Figure 3 of [58]) and Chao et al. (Figure 7 of [59]): colored tracts mark the CC crossing sites of fibers from frontal opercular cortical areas (yellow), motor cortices (green), anterior and posterior parietal cortices (red), temporal cortices (black), and occipital cortices (blue).