
Figure 2.
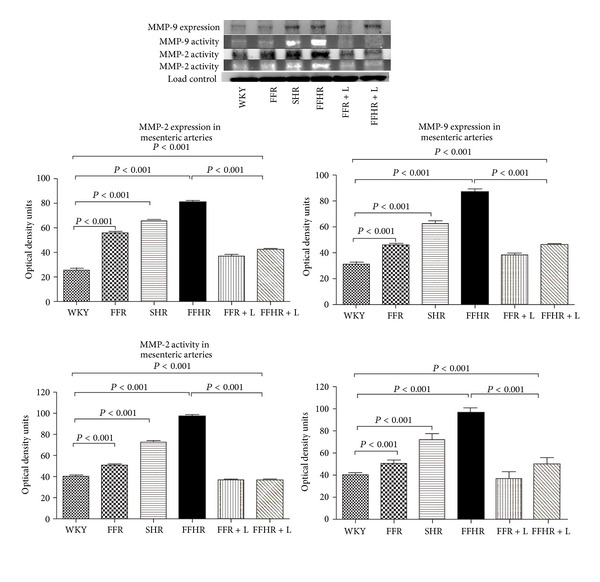
A representative polyacrylamide gel for Western blot and zymography for collagenases (MMP-2 and MMP-9). This image showed activity and expression of collagenases contrasted for each experimental group. The picture below shows the bar graph with statistical analysis.