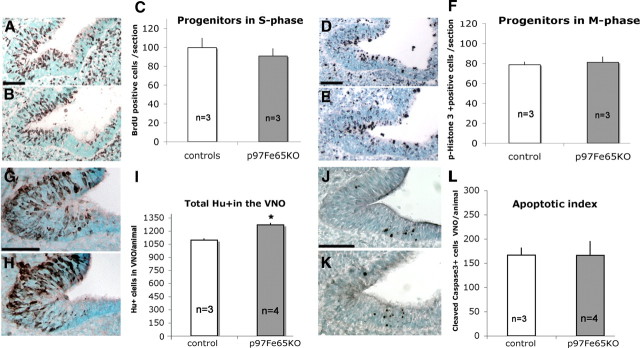
Figure 10.
Increased neurogenesis without changes in proliferation or cell death. A–C, Representative VNO section of control (A) and FE65 mutant (B) littermates stained for BrdU after short BrdU pulse. C, Means of BrdU-positive cells per section at E11.5. The number of proliferating cells in S phase was similar in FE65 mutants and controls. D–F, Sections of control (D) and FE65 mutant (E) after phospho-histone-3 immunostaining. E, Means of phospho-histone-3-positive cells per section at E11.5; no significant differences were found in number of cells in M phase. G–I, An increased number of Hu-positive precursors was detected in FE65 mutants. Representative VNO sections of control (G) and FE65 mutant (H) littermates stained for Hu (brown). I, Means of total Hu-positive cells in VNO per animal at E11.5. J–L, The number of apoptotic cells was similar in controls and FE65 mutants. Representative VNO sections of control (J) and FE65 mutant (K) littermates stained for active caspase-3 (black). Values ± SE, n = number of animals analyzed. *p < 0.05, t test. Scale bar, 50 μm.

