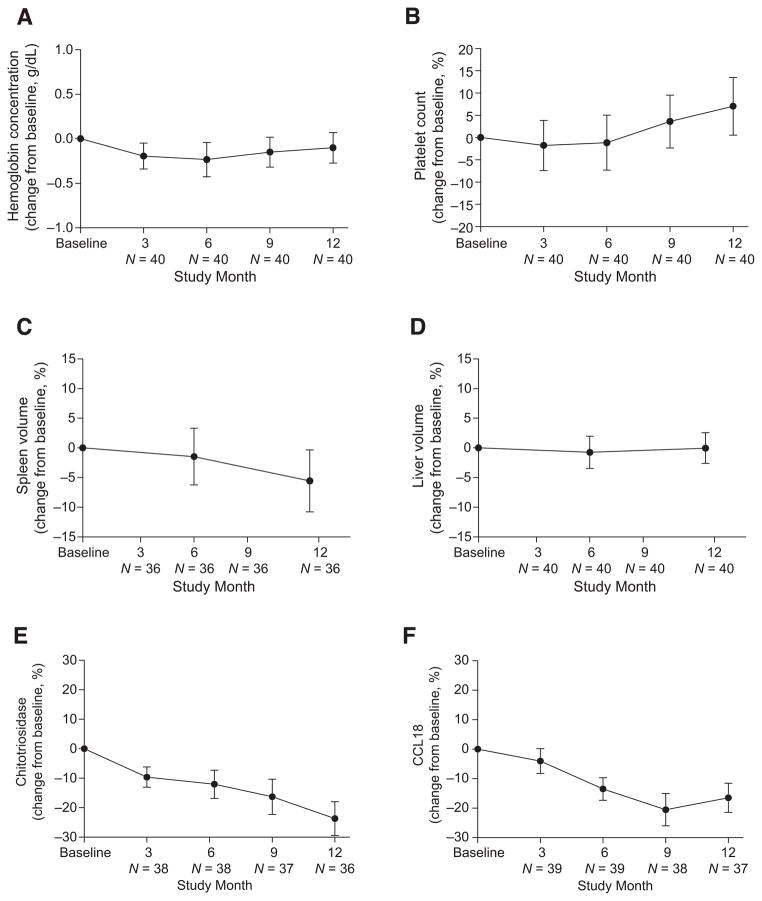
Figure 1.
Change in hematological parameters, organ volume, and biomarkers relative to baseline during 12 months’ treatment with velaglucerase alfa. Mean change from baseline (90% CI) through 12 months’ treatment with velaglucerase alfa for hemoglobin concentrations (indicated as absolute change; A) and platelet counts (indicated as percentage change; B). Mean percentage change from baseline (90% CI) through 12 months’ treatment with velaglucerase alfa for spleen volume (C) and liver volume (D). Mean percentage change from baseline (90% CI) through 12 months’ treatment with velaglucerase alfa for chitotriosidase activity (E) and CCL18 levels (F). One patient deficient in chitotriosidase was excluded from the analysis of chitotriosidase activity.

