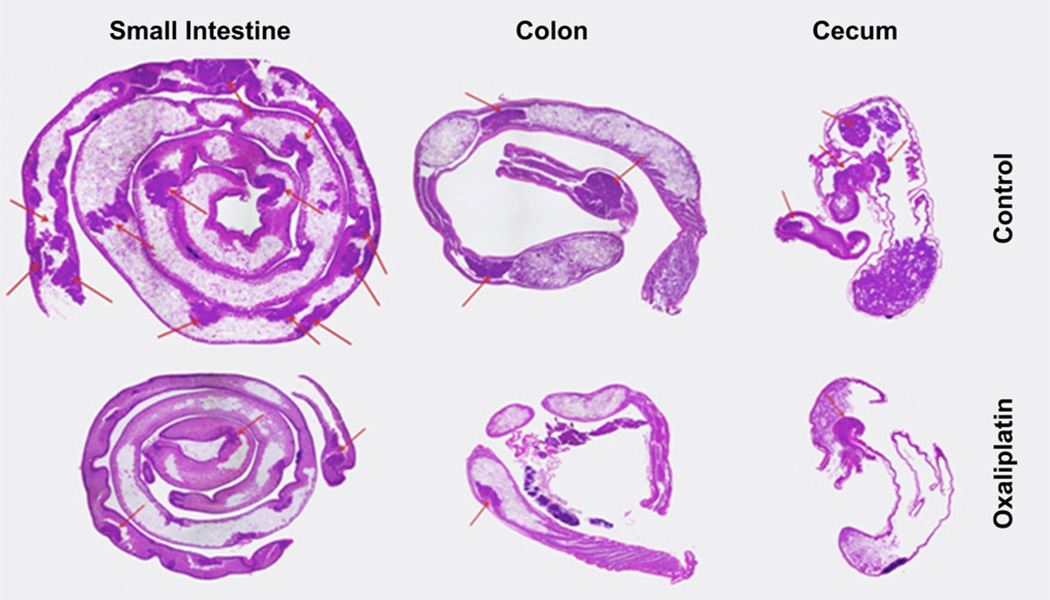
Fig. 4.
H&E tissue staining of mice polyps in small intestine, colon and cecum for control and oxaliplatin treatment group. Control mice had a higher number of polyps, indicated with red arrows, in the small intestine, colon and cecum compared with oxaliplatin treatment group. (For interpretation of the references to colour in this figure legend, the reader is referred to the web version of this article.)

