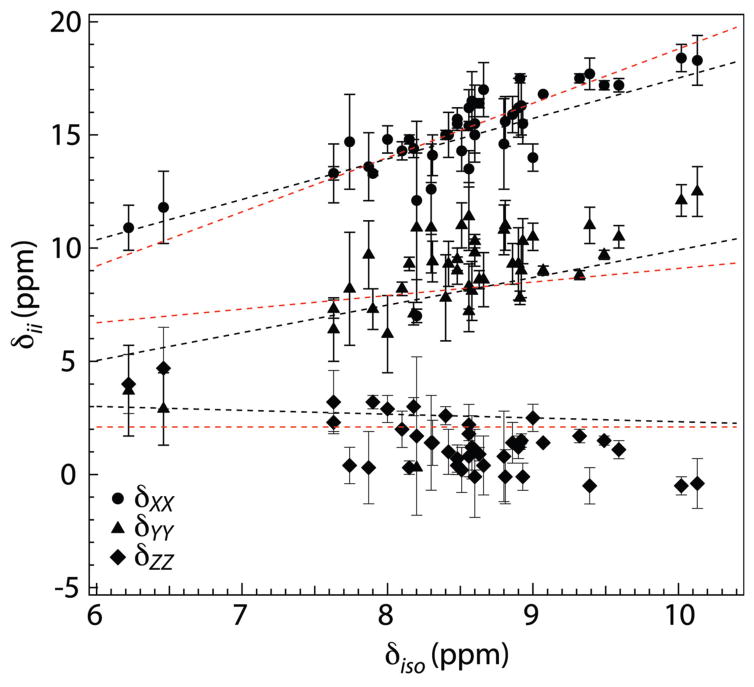
Figure 6.
Principal components of 1H CSA tensors observed for 42 residues of U-13C,15N-CAP-Gly domain of mammalian dynactin, plotted as a function of the isotropic 1H chemical shifts: δXX (circles), δYY (traingles), and δZZ (diamonds). The straight lines represent the linear regression through similar CS plots of ubiquitin by Loth et al.19 (red: δXX = 2.4δiso − 5.2 ppm; δYY = 0.6δiso + 3.1 ppm; δZZ = 2.1 ppm) and of GB3 by Yao et al.20 (black: δXX = 1.79δiso − 0.38 ppm; δYY = 1.22δiso − 2.28 ppm; δZZ = −0.17δiso + 4.03 ppm). The three best fit lines through our experimental data are (not shown): δXX = 2.0δiso − 1.7 ppm (RP = 0.85, p = 4.3×10⁻¹³); δYY = 2.0δiso − 8.3 ppm (RP = 0.78, p = 7.5×10⁻¹⁰); δZZ = −1.04δiso + 10.2 ppm (RP = −0.65, p = 3.3×10⁻⁶).

