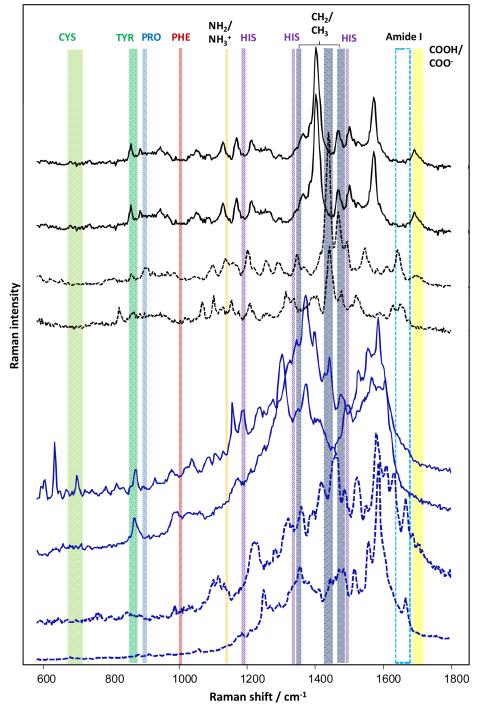
Fig. 1.
Selected TERS spectra (black) and SERS spectra (blue) of insulin fibrils with suppressed amide I bands (—) and with evident amide I bands (---). Insulin fibrils were immobilized on a glass slide for TERS measurements. An AFM tip covered by silver nanoparticles was used. A silver island film evaporated on a glass slide18 was used in the SERS experiments. For both TERS and SERS measurements, the excitation laser light with l = 532 nm was used.

