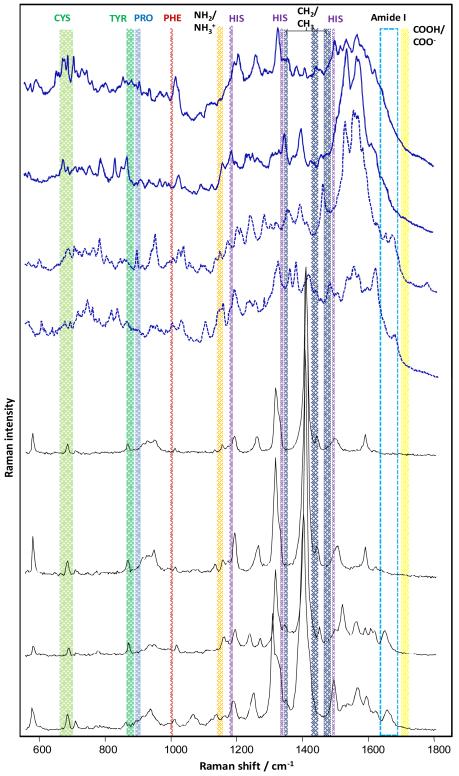
Fig. 2.
SERS (black) and TERS (blue) spectra of native insulin with suppressed amide I bands (—) and with detectable amide I bands (---). For SERS, insulin was mixed with gold nano-particles and laser excitation at λ =785 nm was used. For TERS a silver island coated AFM tip and excitation at λ =532 nm was used.

