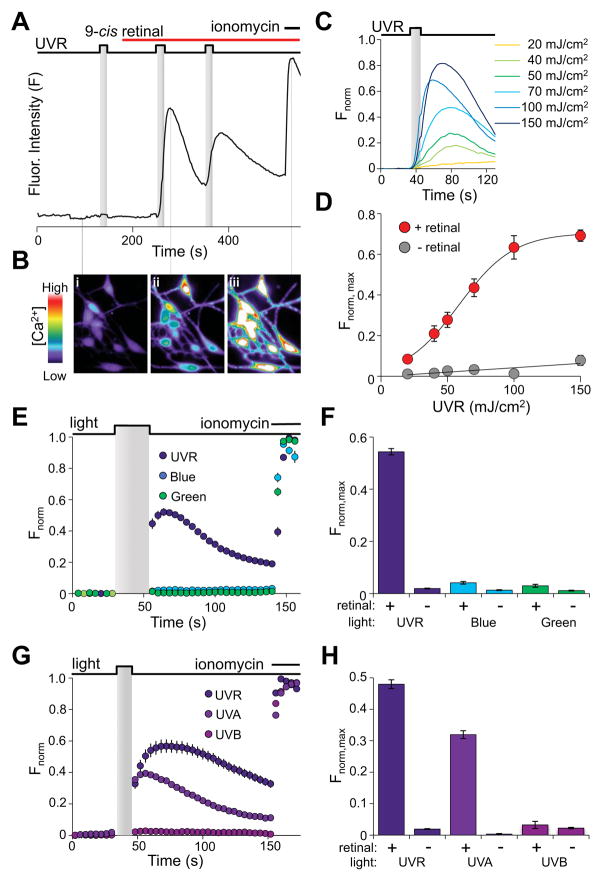
Figure 1. UVR induces retinal-dependent calcium responses in HEMs.
A. Fluorometric Ca2+ imaging trace of a representative HEM stimulated with two 100 mJ/cm2 (10 mW/cm2 for 10 s) UVR pulses shows a measurable increase in fluorescence intensity (F) only after incubation with 9-cis retinal (10 μM). Ionomycin (1 μM) was added for maximal fluorescence intensity.
B. Pseudochrome fluorescence images of HEMs at three time points during the Ca2+ imaging protocol shown in A indicate (i) no Ca2+ increase with UVR stimulation in the absence of 9-cis retinal, (ii) increased Ca2+ in response to UVR applied after incubation with 9-cis retinal, and (iii) maximal Ca2+ increase with ionomycin.
C. Normalized fluorescence intensity (Fnorm) of representative HEMs preincubated with 9-cis retinal (10 μM) and stimulated with 20 – 150 mJ/cm2 of UVR (10 mW/cm2 for 2 – 15 s) as a function of time.
D. Mean amplitudes of Ca2+ responses (Fnorm, max) measured in HEMs exposed to the indicated UVR dose, either with (red) or without (gray) 9-cis retinal represented as a function of dose and fit with a sigmoid function. n ≥ 13 cells for each data point; ± s.e.m.
E. Normalized fluorescence intensity (Fnorm) of HEMs pre-incubated with 9-cis retinal (10 μM) and stimulated with 200 mJ/cm2 (10mW/cm2 for 20 s) UVR (280 – 400 nm), blue light (435 – 460 nm), or green light (500 – 550 nm) as a function of time. Ionomycin (1 μM) was used for normalization. n ≥ 8 cells for each trace; ± s.e.m.
F. Wavelength profile of retinal-dependent Ca2+ responses in HEMs. Peak fluorescence responses (Fnorm, max) of HEMs exposed to 200 mJ/cm2 (20 s of 10 mW/cm2) of UVR (purple), blue light (blue) or green light (green), in the absence (−) or presence (+) of 9-cis retinal (10 μM). Ionomycin (1 μM) was used for normalization. n = 16 – 32 cells, from ≥3 independent experiments; ± s.e.m., P ≤ 0.001 for UVR vs. either blue or green light.
G. Normalized fluorescence intensity (Fnorm) of HEMs pre-incubated with 9-cis retinal (10 μM) and stimulated with 200 mJ/cm2 (20 mW/cm2 for 10 s) UVR (280 – 400 nm; ~90% UVA, ~10% UVB), 180 mJ/cm2 (18 mW/cm2 for 10 s) UVA (320 – 400 nm), or 20 mJ/cm2 (2 mW/cm2 for 10 s) UVB (280 – 320 nm), as a function of time. Ionomycin (1 μM) was used for normalization. n ≥ 8 cells for each condition; ± s.e.m.
H. Mean amplitudes (Fnorm, max) of Ca2+ increases of HEMs exposed to either UVR, UVA or UVB as in G, in the absence (−) or presence (+) of 9-cis retinal (10 μM). Ionomycin (1 μM) was used for normalization. n = 16 – 32 cells from ≥3 independent experiments; ± s.e.m., P < 0.001 for UVR or UVA vs. UVB. See also Fig. S1.

