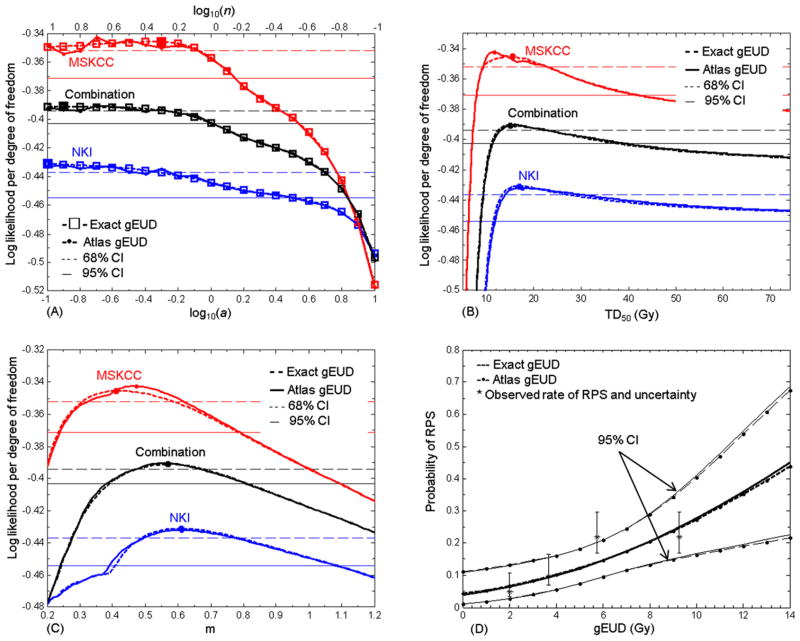
Fig 3.
Lyman-Kutcher-Burman model analysis for radiation pneumonitis requiring steroids or worse. (A) Log likelihood profiles per degree of freedom for a, for the Netherlands Cancer Institute (blue), Memorial Sloan-Kettering Cancer Center (red), and the combined (black) data. Profiles using exact generalized equivalent uniform dose (gEUD) values are shown with dashed lines and open squares; those using the atlas are shown with solid lines and dots. Colored horizontal lines show the respective 68% (thin dashed lines) and 95% (thin solid lines) confidence level for the log likelihood. Log likelihood curves are flat around their maximum values (darker squares) at small a for both individual data sets and their combination. (B) and (C) Equivalent profiles for TD50 and m. (D) Response functions at best fit a (log10(a) = −0.9), with 95% confidence intervals (CIs), compared with the observed complication rates with 68% CIs for each quartile in gEUD, plotted at each quartile’s median.

