
Figure 3.
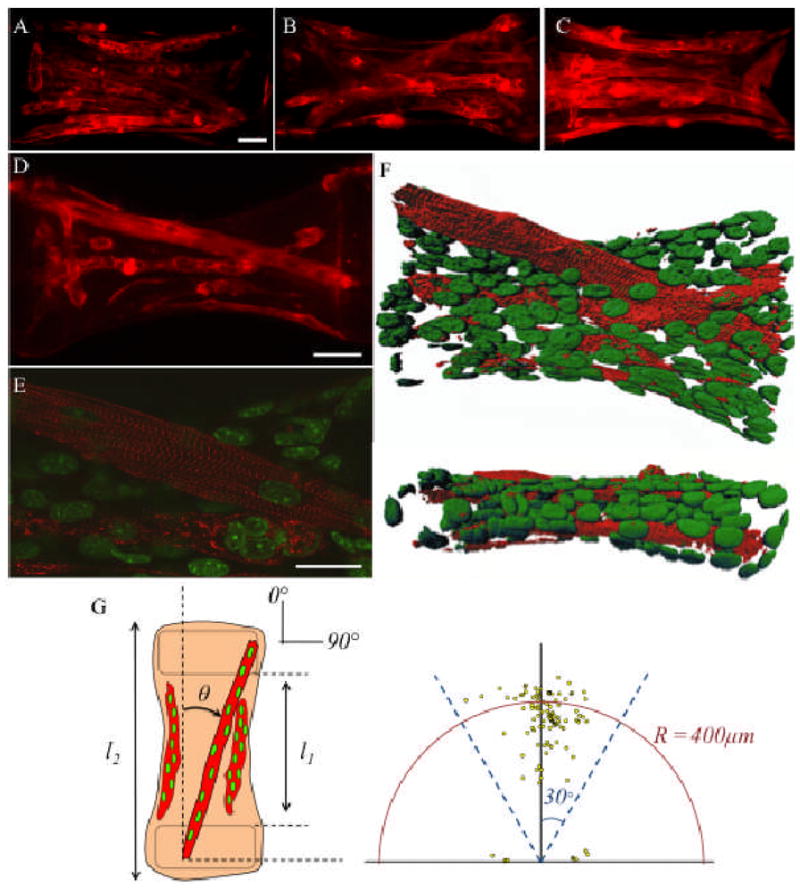
Distribution and differentiation of skeletal muscle myotubes in engineered microtissues. (A–C) Representative α-actinin immunostaining images showing the distribution and alignment of striated myotubes after 3 weeks of culture. (D) Representative α-actinin immunostaining image shows sarcomere formation and (E) a representative confocal section from the same construct shows that aligned multinucleated myotubes exhibit ubiquitous cross-striations. (F) 3D reconstruction of confocal slices for the construct shown in (D). The upper panel shows the top and the lower panel shows the side view of the same microtissue. Nuclei (green) are elongated in the direction of stress gradients. (G) Characterization of cell alignment and myotube length in the microtissues. The location of each point in the scatter plot shows the length and orientation of a myotube. Data are collected from 20 SMTs having a total of 150 myotubes. (Scale bars: A and D, 50 μm; E, 25 μm).