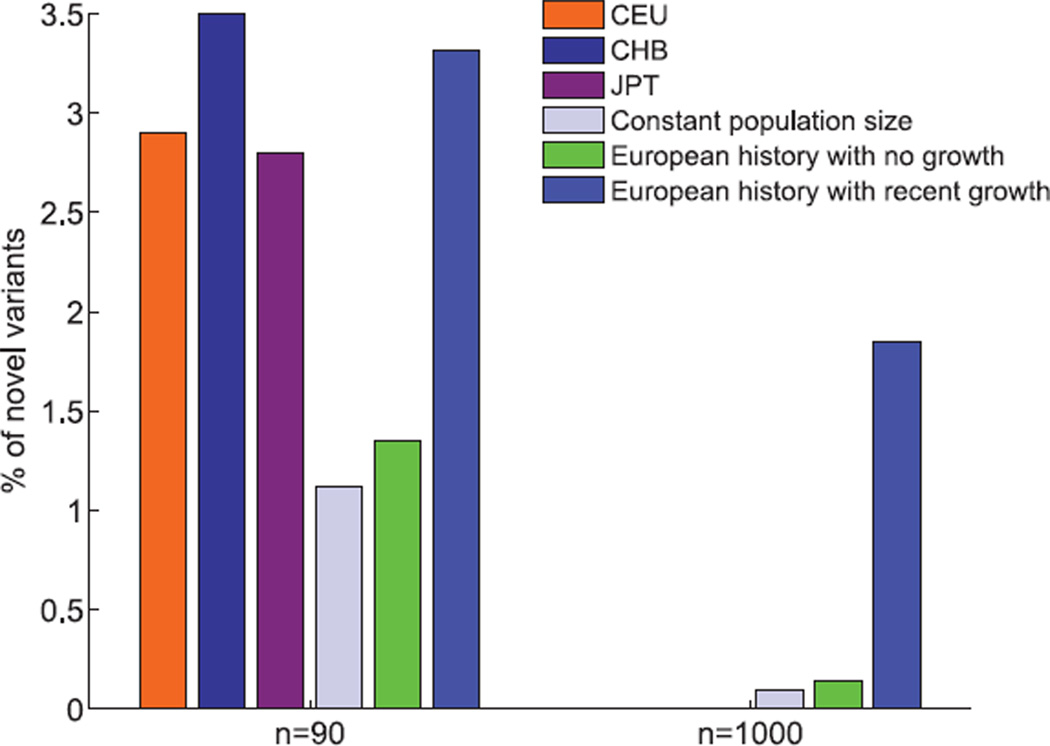
Fig. 3.
Percentage of novel variants in a sequenced individual. Bars denote the fraction, out of all sites for which a given individual is heterozygous, that are also monomorphic in a separate sample of 90 (left) or 1000 (right) individuals from the same population. Expected fraction is presented for the same three demographic models as in Fig. 2. For n = 90—a value chosen on the basis of availability of empirical data—the observed fraction for three populations of European (CEU), Chinese (CHB), and Japanese (JPT) ancestry is also provided, from resequencing data of ENCODE regions from the HapMap 3 Project (22). We averaged over all possible choices of an individual out of each sample in these data. The empirical results are inconsistent with the two models excluding growth, and they match a simplistic model that includes recent exponential expansion. We note that the empirical estimates are likely slight underestimates due to stringent quality control filters (22). No empirical data are available for a sample of size 1000.

