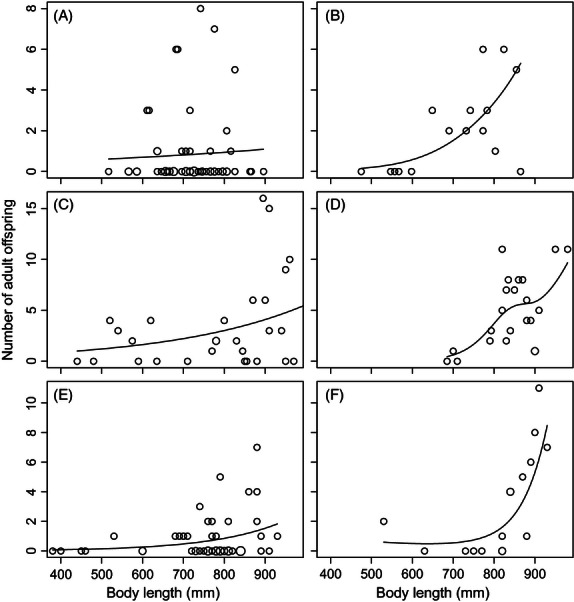
Figure 3.

Relationship between body size and reproductive success (RS) for male (A, C, E) and female (B, D, F) Chinook salmon spawning in 2003 (A and B), 2004, (C and D), and 2005 (E and F). Lines represent cubic splines fit with a negative binomial error structure. In some cases, there are multiple observations on the same data point, and the size of the circle is proportional to the number of observations (maximum of four observations per point). One outlier male from 2004 (1100 mm, RS = 1) is not shown.
