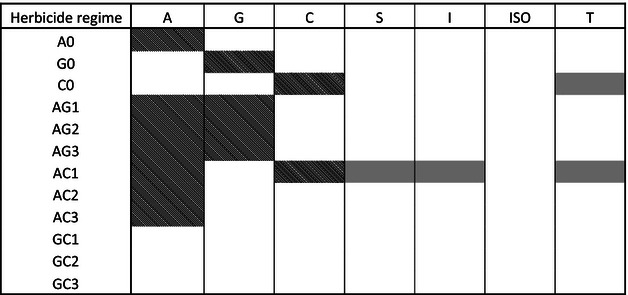
Figure 4.

Resistance profiles for evolved populations. Hatched shading indicates resistance to herbicides included in corresponding selection regimes. Cross-resistance to herbicides to which populations had no previous exposure is indicated by grey shading. Cross-resistance was only selected in the C0 and AC1 regimes. A = atrazine; G = glyphosate; C = carbetamide; S = S-metolachlor; I = iodosulphuron; Iso = isoproturon; T = tembotrione.
