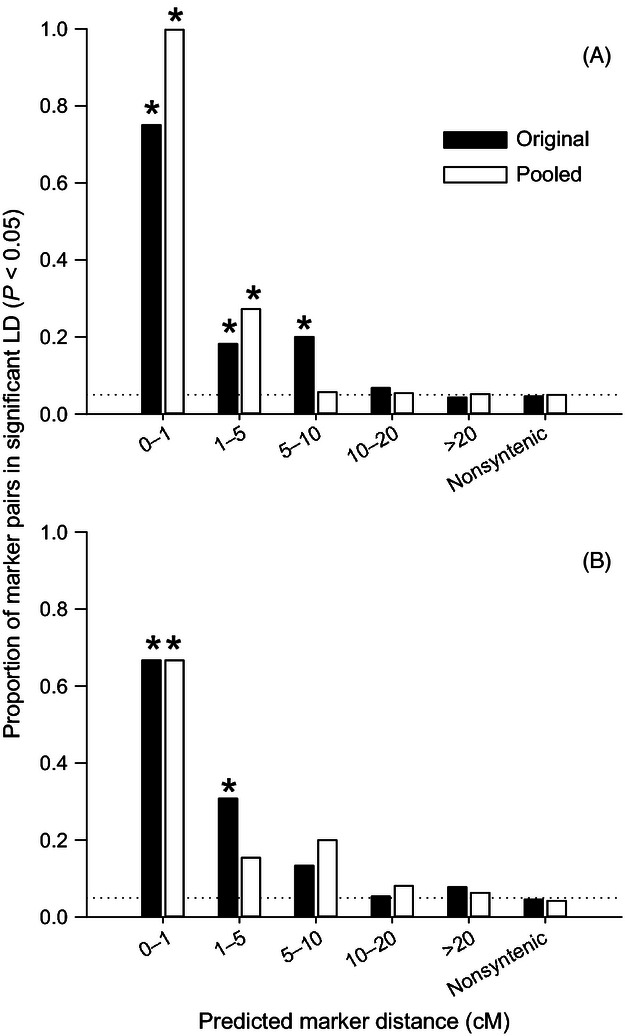
Figure 3.

Proportions of marker pairs in significant linkage disequilibrium (LD) (P < 0.05) summarized by predicted marker intervals (cM) in white-tailed deer (A) and mule deer (B) tested using both original genotype and pooled genotype data (rare alleles with frequency < 0.05 were pooled). Dotted lines indicate the type I error rate (α = 0.05). Proportions of significant LD in nonsyntenic marker pairs were statistically equivalent to the type I error rate in both species using both data sets. *Significant difference from the nonsyntenic proportions after the Bonferroni correction.
