
Figure 3.
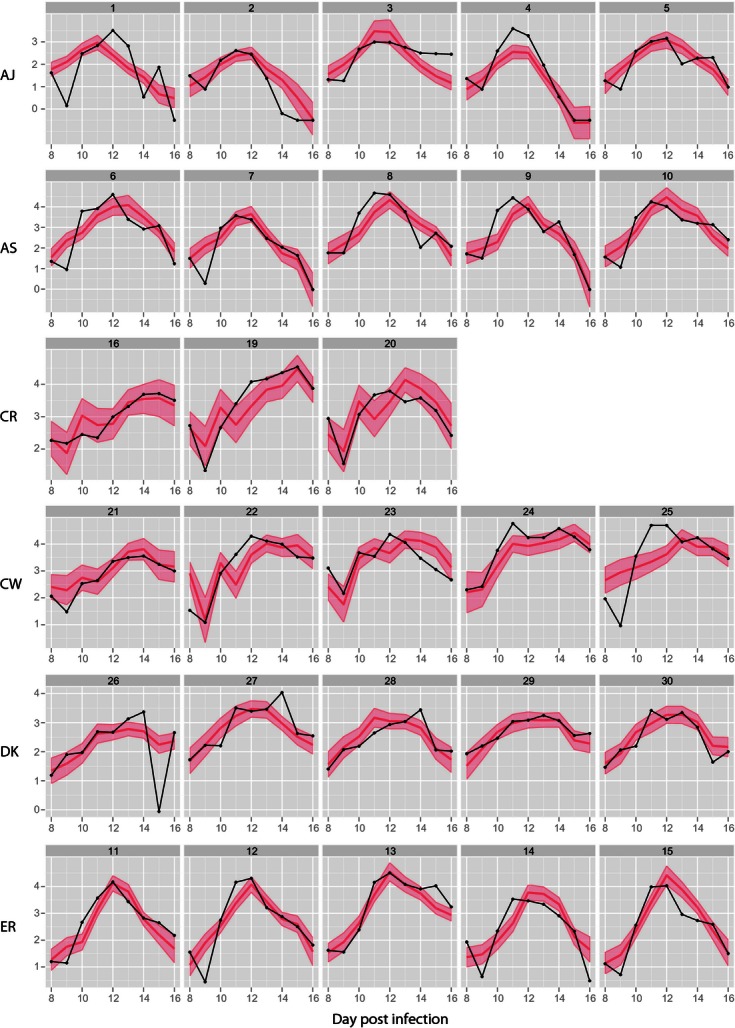
Best-fits to gametocyte density for each mouse, by strain. Y axes show the logarithm to base 10 of gametocyte densities per ml of blood. Dark red lines are best-fit predictions and shaded regions are 95% uncertainty envelopes obtained by resampling the parameters from their empirical distributions.