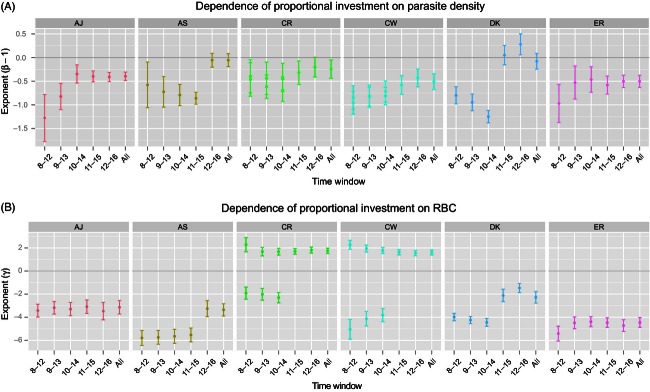
Figure 4.

Best-fit exponents β and γ in the model  , stratified by 5-day time windows. For the first three time windows (days 8–12, 9–13, 10–14), the CR and CW data were described by two models with equivalent support, as described in the text. Upper panel – the dependence on the proportional investment in gametocytes on the asexual parasite density, M. Gametocyte numbers are modelled as Mβ and so the probability per asexual parasite of committing to gametocytogenesis varies as Mβ−1. A negative value for the exponent β − 1 implies an inverse relation between parasite density and transmission investment. Lower panel; the per-parasite probability of becoming a gametocyte is modelled as proportional to Xγ where X is either total red blood cells (RBC), mature RBC or reticulocytes. Negative values of γ were obtained for genotypes AJ, AS, DK and ER across the whole time course, showing that these genotypes invest more in transmission as RBC resources decline. For genotypes CR and CW, positive values of γ were associated with reticulocytes; negative for total RBC.
