
Figure 2.
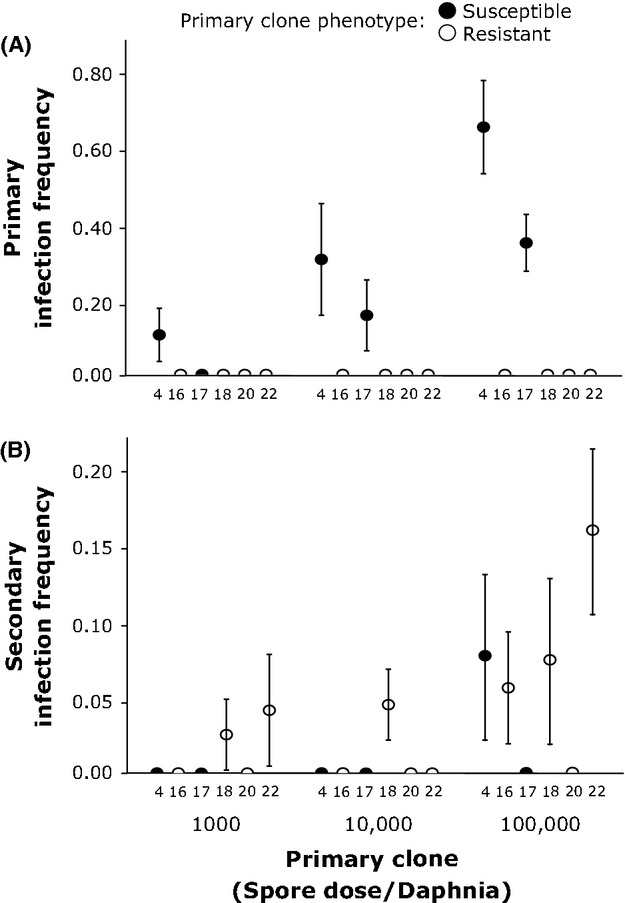
Infection frequencies in (A) primary and (B) secondary exposure treatments in experiment I. Three parasites doses were used: 1000, 10,000, and 100,000 spores/Daphnia. Infection frequencies are presented for six clonal genotypes (4, 16, 17, 18, 20, 22) in the primary exposure treatment and the clones (all 4) exposed in the secondary exposure treatment. The phenotypes (susceptible, resistant) of primary clones are shown. Error bars represent ± 1 SE. Note the y-axis scales are different between graphs.