
Figure 2.
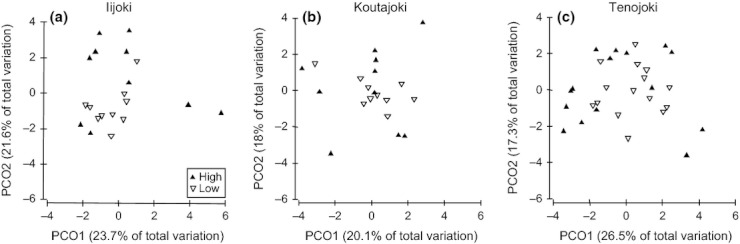
Scatter of sites in environmental PCoA ordination plot in each drainage basin. The sites belonging to the low and high heterogeneity site subsets are shown by different symbols. High = high environmental heterogeneity site subset, Low = low environmental heterogeneity site subset.