Figure 3.

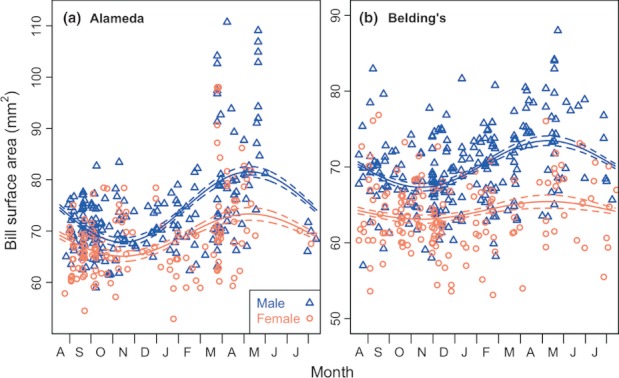
Bill surface area plotted by collection date (1–365 starting at August 16) and separated by sex for A) Alameda song sparrow and B) Belding's savannah sparrow. Lines represent predicted values ± standard errors.

Bill surface area plotted by collection date (1–365 starting at August 16) and separated by sex for A) Alameda song sparrow and B) Belding's savannah sparrow. Lines represent predicted values ± standard errors.