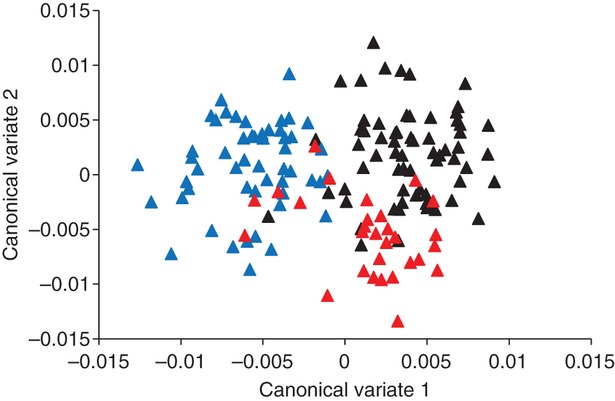
Figure 4.

Canonical Variate Analysis plot of F1 lineages. The F1 generation was comprised of three distinct ancestral populations: Bear River, ID (black triangles), Green River, UT (blue triangles), and Polecat Creek, WY (red triangles). Canonical Variate 1 was significant (P < 0.0001) and comprised 84.5% of the total variation. Canonical Variate 2 was not significant (P = 0.15) and comprised 15.3% of the total variation.
