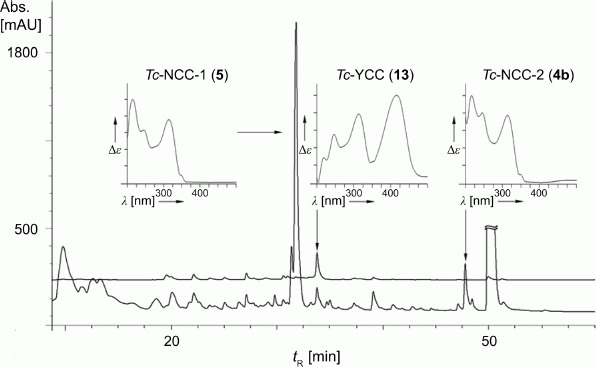
Fig 1.

HPLC Analysis of an extract of senescent leaves of Tilia cordata (lower trace: detection at 320 nm, trace above: detection at 420 nm). For details, see the Exper. Part. Insets: Online UV/VIS spectra of Tc-NCC-1 (5; left), Tc-YCC (13; middle), and Tc-NCC-2 (4b; right).
